Competing Risks Analysis
New in Version 2025, the Competing Risks Weibull model provides a way to analyze data sets where more than one failure mode must be considered for every data point.
In effect this method is closer to the Mixed Weibull approach, but more applicable to real world data, and as opposed to competing failure modes analysis, where the failure mode for each data point is known and specified by the user.
To use competing risks analysis, you will need to specify how many subpopulations exist in the data set (2, 3 or 4). The software will then determine the proportion of units that fall under each subpopulation and calculate the Weibull parameters of those subpopulations. The overall reliability of the full data set is then calculated by taking the sum of the proportional reliability contributions of each subpopulation.
Example
The data set used in this example is available in the example database installed with the Weibull++ software (called "Weibull25_Examples.rsgz25"). To access this database file, choose File > Help, click Open Examples Folder, then browse for the file in the Weibull sub-folder.
The name of the project is "Life Data - Competing Risks."
A product underwent development testing, yielding the following data set.
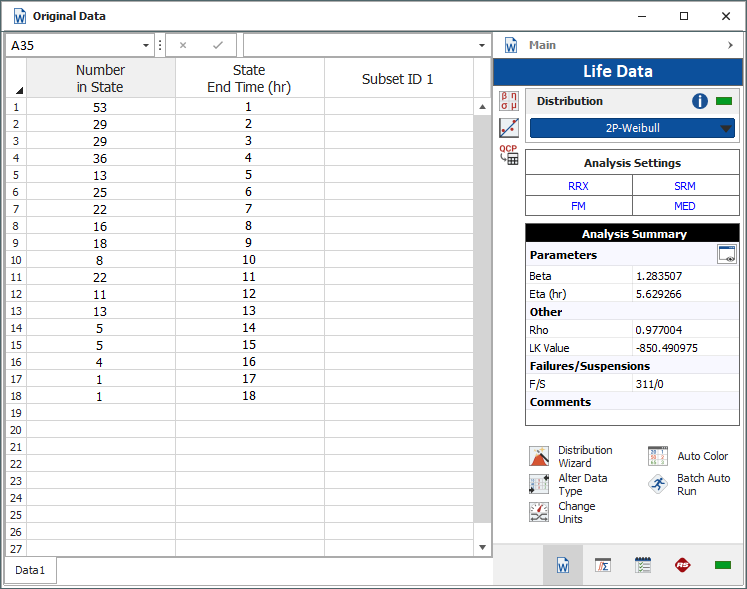
The engineers believe that there are two failure modes behind this data set. The initial failures are thought to be due to defectively made products, while the later failures may be due to wearout and fatigue. Taking this into account, they believe that the failure rate follows a "bathtub" curve.
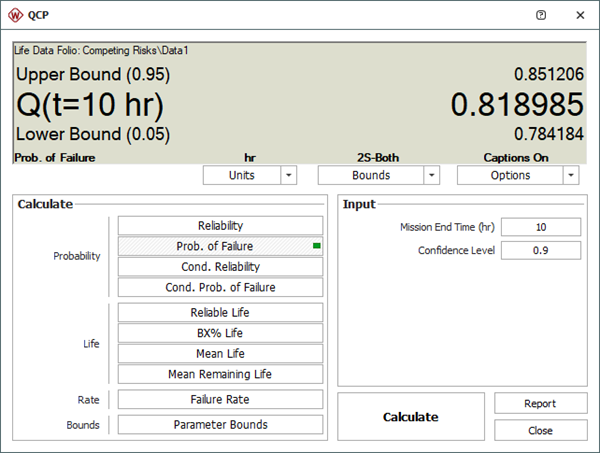
The goal is to calculate the probability of failure at 10 hours.
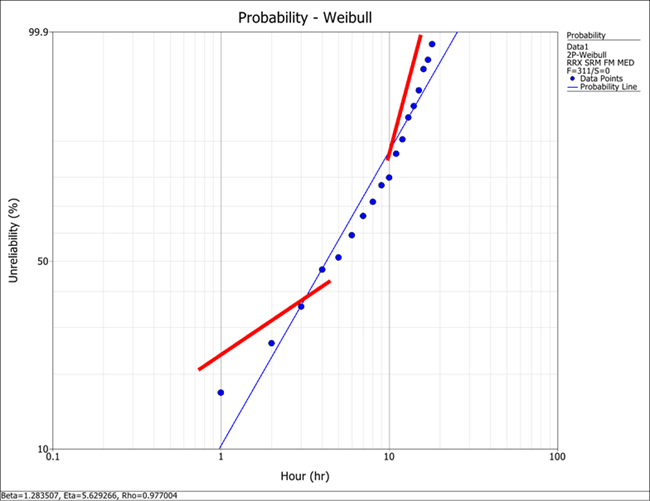
An initial analysis of the data set is done using a 2-parameter Weibull distribution. The probability of failure plot of this analysis shows that there do appear to be two separate failure modes, suggesting that a 2-subpopulation Competing Risks analysis may be appropriate here.
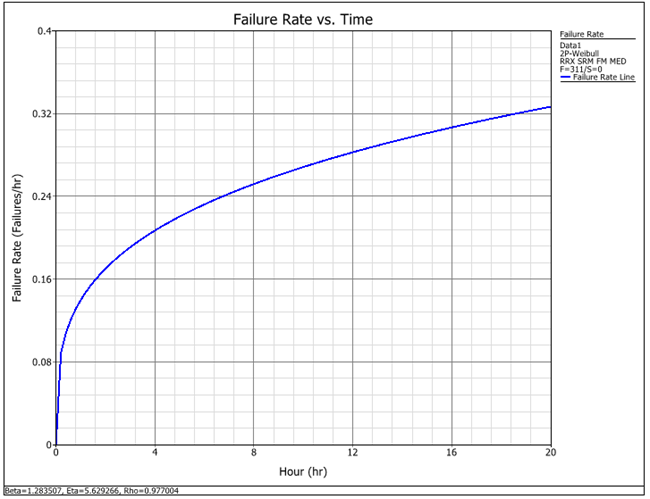
The failure rate plot is:
Also, upon further investigation, it was discovered that the data was actually interval data, so an updated data set was used, as shown next.
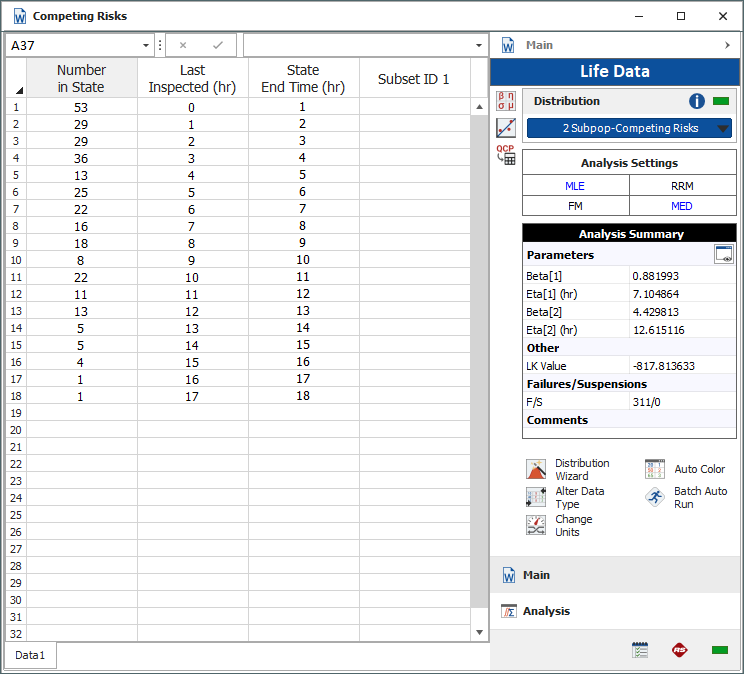
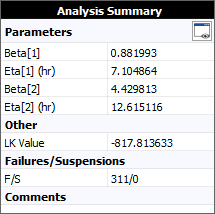
Using the 2-Subpopulation Competing Risks models gives parameters for the separate failure modes: infant mortality and wearout.
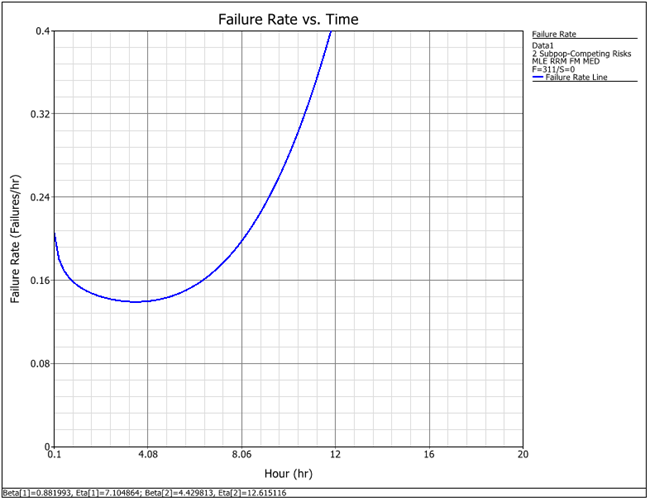
The following plot shows the failure rate over time.
Using the QCP to calculate the probability of failure at 10 hours with 2-sided confidence bounds shows that the probability of failure at 10 hours is 81.90%.
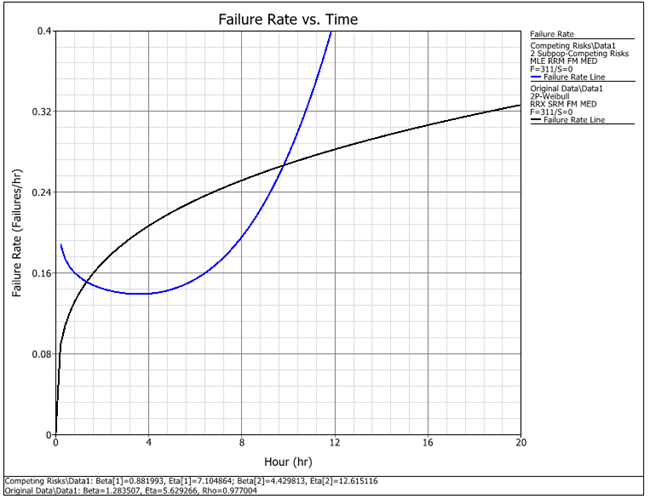
By comparing the two failure rate plots you can see that the Competing Risks distribution more accurately models the bathtub curve that is expected based on engineering knowledge.
The data set for this example appears in Table 2, page 91 in [1]. The analysis of this data set is also based on the analysis given on pages 90-92 in [1].
Reference
[1] M. Xie, C.D. Lai, “Reliability Analysis Using an Additive Weibull Model with Bathtub-Shaped Failure Rate Function”, Reliability Engineering and System Safety 52 (1995) 87-93.