FMEA Web Data Source
You can use SEP as a web data source in an external reporting tool such as Excel or Power BI or in your own custom application. This service is designed for those who have specialized reporting needs that are not directly supported in SEP. Note that this feature is not available when viewing SEP on most mobile devices.
The FMEA web data source links to the fields, ratings and metrics that have been defined as part of the “interface style” for a project. (See Interface Styles in the XFMEA/RCM++ help.)
- In the Queries & Data tab on SEP’s FMEAs page, change the project (if necessary) and then select the FMEAs that you wish to include in your data. You can select individual FMEAs from the hierarchy or use the Select All option to select all FMEAs in the project.
Note: The number of FMEAs you can select is limited by the length of the generated link, which cannot exceed 2000 characters. If an error message appears indicating that you have selected too many items, try using the Select All option instead.
- In the Web Data Source area, click either the XML or JSON button. This will open a pop-up box displaying the URL.
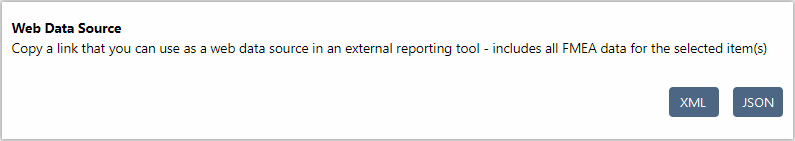
- XML is the preferred method if you plan to use the data in a tool such as Power BI or Excel. Since these tools recognize XML data formats and relationships automatically, no additional steps will be required to prepare your data for reporting or visualization.
- JSON may be preferable for certain custom programming applications.
- Right-click to display a shortcut menu and click Copy to copy the URL for use in your reporting / visualization tool.
Example: Using XML Data in Power BI
Power BI is just one of the many tools that can use SEP as a web data source. In the following example, copy the link as described above and perform the steps listed below; this process is also similar for Excel.
- Open Power BI and click Get Data.
- In the Get Data dialog box, select Other > Web and click Connect.
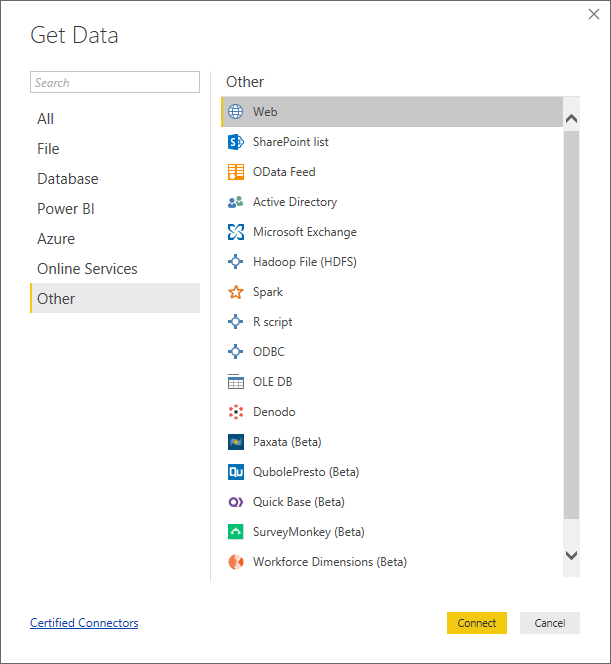
- In the From Web dialog box, paste the URL you copied from SEP and click OK.
- Expand each of the tables you wish to include in your data set, select them and click Load.
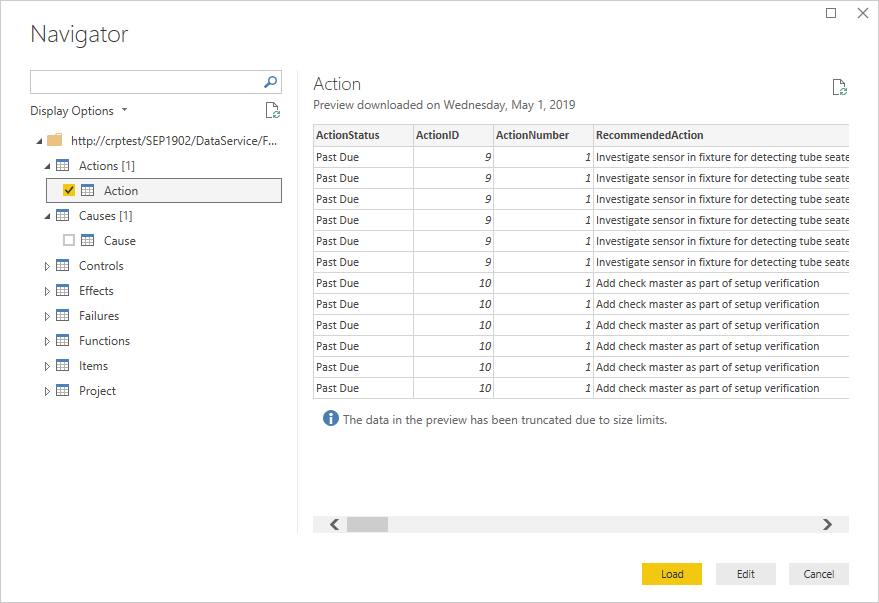
- Use the data to perform analyses and create visualizations.
- Save your project so you can access this data later.