SEP and XFRACAS
XFRACAS is a highly configurable, web-based, failure reporting, analysis and corrective action system (FRACAS) with integrated capabilities for part tracking, root cause analysis and team-based problem resolution. If your organization implements both the SEP and XFRACAS websites for the same enterprise database, SEP can include links to the following types of XFRACAS records:
- Actions and incidents that you “own”
- Observed occurrences of incidents, failure analysis reports and/or problems that are associated with an item or failure mode in an FMEA
- Reports and charts that you have selected to “watch” in XFRACAS
Tip: The links between SEP and XFRACAS must be configured in XFRACAS by an admin user (Admin > Configure > Preferences). In the System-Wide Preferences section, set the Display SEP Command to TRUE and specify two servers: XFRACAS Server - IIS Prefix (e.g., servername/SEP) and SEP Server - IIS Prefix (e.g., servername/SEP).
XFRACAS Actions and Incidents
Two SEP dashboard tiles — the FRACAS Actions Grid and the FRACAS Incidents Grid — allow you to view the XFRACAS actions and incidents that you own. (See FRACAS Tiles.)
Tip: You can also show actions from ReliaSoft desktop applications in your XFRACAS portal, if desired. Open the Portal Preferences page in XFRACAS and configure the Display My Open ReliaSoft Desktop Actions option.
Field Failure Reports (Observed Occurrences)
SEP’s FMEAs page provides convenient access to field failure reports from XFRACAS. (See FMEAs in SEP). If your organization chooses to associate template parts and failure modes in XFRACAS with items and failure modes in XFMEA/RCM++, SEP will display the following:
- All FRACAS records that are relevant for a given part
- Quantities of “observed occurrences” for failure modes that correspond to specific parts
See Import or Sync from XFRACAS in the XFMEA/RCM++ documentation for information on creating associations for parts and failure modes.
View All Records for an Item
To view all XFRACAS incidents, problems or failure analyses that have been reported for a specific item:
- Navigate to the FMEAs page and select the Hierarchy View tab (if necessary).
- Click the
 icon next to the item in the system hierarchy.
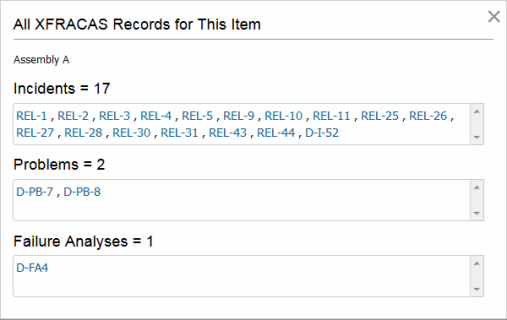
This opens a pop-up box showing all XFRACAS records for items that are identified as the "Responsible Part" for an incident, the "Part Category" for a problem or the "Repaired/Replaced Part" for a failure analysis. To open the incident, problem or failure analysis in SEP, click the record number .
Note: The XFRACAS reports that you open from SEP are based on the standard templates defined in XFRACAS for incidents, problems and failure analyses. However, SEP adds query criteria to retrieve results for a particular item and/or failure mode. Since these criteria are not saved with the template, you cannot "watch" the report, nor can you use the URL for the results page to regenerate the same results; instead, you must click the link within SEP.
View Records for a Failure Mode
To view the quantity of XFRACAS records that have been reported for a failure for a specific item, make sure the Observed Occurrences column is displayed in the FMEA hierarchy. (See "FMEAs.")
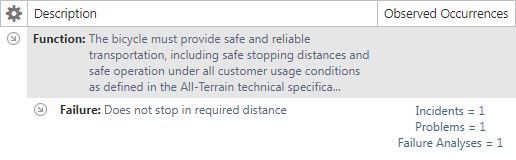
To open a pop-up box that contains links to the records and reports for a particular failure, click the Observed Occurrences links.
XFRACAS Reports and Charts
The watch feature in XFRACAS provides a quick, convenient way to access the XFRACAS reports and charts that you use most often (e.g., incident count by responsible part, all open incidents for a particular system, etc.).
When SEP and XFRACAS are linked, watches are created automatically in SEP for any reports or charts that you choose to watch in XFRACAS; however, these watches are not synchronized after the original creation. If you later delete the watch in XFRACAS, it will not update in SEP. Likewise, if you later delete or rename the watch in SEP, it will not change the original watch in XFRACAS.