
Appendix A: Least Squares/Rank Regression Equations
Rank Regression on Y
Assume that a set of data pairs (x1, y1), (x2, y2), ... , (xN, yN), were obtained and plotted. Then, according to the least squares principle, which minimizes the vertical distance between the data points and the straight line fitted to the data, the best fitting straight line to these data is the straight line y = a + bx such that:


and where  and
and
 are the least squares estimates of
a and b, and N is the number of data points.
are the least squares estimates of
a and b, and N is the number of data points.


To obtain  and
and
 , let:


Differentiating F with respect to a and b yields:

|
(1) |
| and: | |

|
(2) |


Setting Eqns. (1) and (2) equal to zero yields:

|
|
| and: | |

|
|


Solving the equations simultaneously yields:

|
(3) |
| and: | |

|
(4) |


Rank Regression on X
Assume that a set of data pairs (x1, y1), (x2, y2), ... , (xN, yN) were obtained and plotted. Then, according to the least squares principle, which minimizes the horizontal distance between the data points and the straight line fitted to the data, the best fitting straight line to these data is the straight line x = a + by such that:


Again,  and
and
 are the least squares estimates of a and b, and N is the number of data points.
To obtain  and
and
 , let:


Differentiating F with respect to a and b yields:

|
(5) |
| and: | |

|
(6) |


Setting Eqns. (5) and (6) equal to zero yields:

|
|
| and: | |

|
|


Solving the above equations simultaneously yields:

|
(7) |
| and: | |

|
(8) |


Solving the equation of the line for y yields:


Example
Fit a least squares straight line using regression on X and regression on Y to the following data:
| x | 1 | 2.5 | 4 | 6 | 8 | 9 | 11 | 15 |
|---|---|---|---|---|---|---|---|---|
| y | 1.5 | 2 | 4 | 4 | 5 | 7 | 8 | 10 |
The first step is to generate the following table:

|

|

|

|

|

|
|---|---|---|---|---|---|
| 1 | 1 | 1.5 | 1 | 1.5 | 2.25 |
| 2 | 2.5 | 2 | 6.25 | 5 | 4 |
| 3 | 4 | 4 | 16 | 16 | 16 |
| 4 | 6 | 4 | 36 | 24 | 16 |
| 5 | 8 | 5 | 64 | 40 | 25 |
| 6 | 9 | 7 | 81 | 63 | 49 |
| 7 | 11 | 8 | 121 | 88 | 64 |
| 8 | 15 | 10 | 225 | 150 | 100 |

|
56.5 | 41.5 | 550.25 | 387.5 | 276.25 |


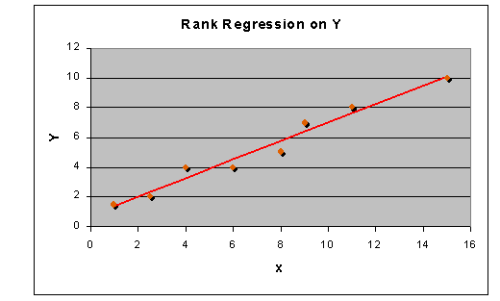
From the table then, and for rank regression on Y (RRY):


- and:


The least squares line is given by:


The plotted line is shown in the next figure.
For rank regression on X (RRX) using the same table yields:


- and:


The least squares line is given by:


The plotted line is shown in the next figure.
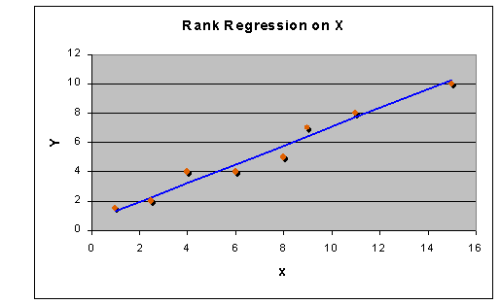
Note that the regression on Y is not necessarily the same as the regression on X. The only time when the two regressions are the same (i.e., will yield the same equation for a line) is when the data lie perfectly on a line.
The correlation coefficient is given by:


![{\displaystyle {\widehat {\rho }}={\frac {387.5-(56.5)(41.5)/8}{[(550.25-(56.5)^{2}/8)(276.25-(41.5)^{2}/8)]^{\frac {1}{2}}}}\,\!}](https://en.wikipedia.org/api/rest_v1/media/math/render/svg/ecd937c223d6cf45e42e1e4fada05d6ebee4a587)

