Showing Metrics in Folios/Diagrams
The Publishing page of the control panel shows all of the metric resources that are associated with the current analysis. (The metrics can be created and edited either from the Resource Manager or the control panel.) This applies for:
- Data sheets in Weibull++ that have a published model.
- Analytical or simulation diagrams in BlockSim that have a published model for the entire system (either a fitted model or an analytical model).
- Simulation diagrams in BlockSim that have simulation results.
This makes it easy to see the metrics that have been created for each analysis (which may also be displayed in relevant Project Planner gates or in the SEP web portal) and to see the history of how the analysis results changed over time. It also provides a convenient way to create new metrics for the analysis, if desired.
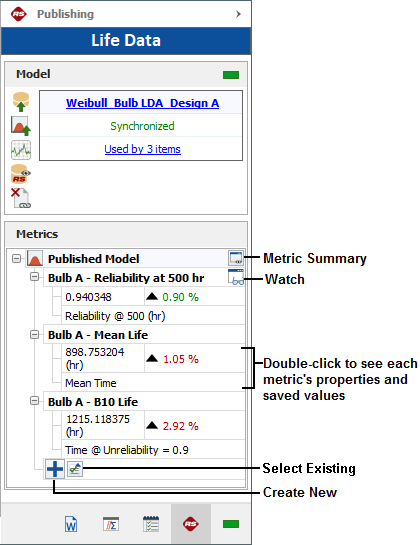
As an example, the following picture shows a typical scenario for Weibull++. In Weibull++, the control panel shows all metrics that are associated with the model published from the current data sheet. In BlockSim, it shows all metrics that are associated with a model published from the diagram and/or obtained from the diagram’s simulation results.
- Double-click a metric to see its properties and history of saved values.
- A Watch icon will be shown beside any metric for which you have subscribed to receive an alert when the resource is changed.
- Click the Metric Summary icon to see a quick report of all the metrics displayed in the current branch.
- Click the Create New icon to create a new metric.
Associating Existing Metrics with a Different Data Sheet
When an analysis changes (e.g., new data, after a design change, etc.), you may choose to simply update the existing data sheet and recalculate, or keep the original analysis unchanged and perform the updated analysis in a new data sheet.
If you decided to create a new data sheet, there are two ways to ensure that the metrics will reflect the complete history from both analyses:
Publish to the existing model from the new data sheet
If you want the published model to reflect the latest analysis results, you can simply transfer both the model and the associated metrics to the new data sheet. To do that:
- Calculate the new data sheet and then go to the Publishing page of the control panel.
- Click Publish to Existing Model and then select the model from the original data sheet.
![]()
Change the model for the for the existing metrics
If you want to keep the original published model associated with the original data sheet, you can publish a new model for the new data sheet and then transfer the metrics to the new model. To do that:
- Publish a new model for the new data sheet.
- From either the original data sheet’s control panel or the Resource Manager, open each metric that was associated with the original data sheet and change the Associated Model.
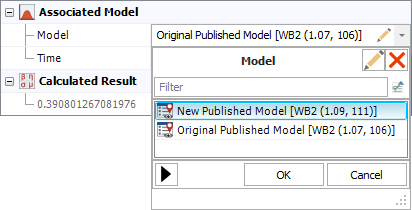
As a shortcut, you can click the Select Existing icon on the new data sheet's control panel and choose one or more existing metrics in the Select Resource window. It is important to keep in mind that when you do this, you are changing the associated model for each selected metric.