Simulation Diagram Dashboards
You can use the flexible Dashboard utility for presenting results from simulation diagrams. To access this feature, choose Simulation > Dashboard.

As with any other dashboard, you can use the Dashboard Viewer to select any of the layouts that have been predefined for this type of data. The Dashboard Manager is used to create or edit layouts. (In a secure database, this is available only to users with the "Manage dashboard layouts" permission.)
Data Source Drop-Down List
When you are creating a dashboard layout based on simulation results, the drop-down list at the top of the Data Source panel gives four options.
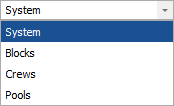
System returns system-level simulation results. Blocks, Crews and Pools return results for the blocks, crews and spare part pools in the diagram.
Note that when different data sources are available, all of the data fields used within a dashboard item must come from the same source. For example, you cannot include fields pertaining to blocks and fields pertaining to crews in the same chart.
Simulation Diagram Dashboard Data Fields
Many of the simulation results available in the Results Explorer are available as data fields for use in simulation diagram dashboard layouts. For detailed explanations of the data fields, refer to the following topics:
- System data fields: See the System Overview worksheet and the System Costs worksheet.
- Blocks data fields: See the Block Details worksheet.
- Crews data fields: See the Crew Details worksheet.
- Pools data fields: See the Spare Part Pool Details worksheet.