Introduction to Phase Diagrams
In BlockSim, phase diagrams are built using phase blocks arranged chronologically to represent each sequential stage in the operation of the system. In much the same way that a subdiagram block within an RBD represents another diagram in the current project, operational phase blocks are linked to simulation RBDs that represent the reliability-wise configuration of the system during each operational phase, while maintenance phase blocks are linked to maintenance templates that describe tasks that need to be completed at some point during the system's operation.
As an example, consider an aircraft with three engines and three landing gear assemblies. The aircraft undergoes five operational phases every time it flies: taxiing, take-off, cruising, landing and taxiing. Each phase is modeled using a simulation RBD.
In a typical mission, the airplane taxies for 15 minutes, takes off for 30 seconds, cruises for 4 hours, lands for 30 seconds and taxies for another 10 minutes. Assume that when a critical failure (system failure) occurs during taxiing, the airplane does not take off and is sent for maintenance instead. However, when a critical failure occurs during take-off, cruising or landing, the system is assumed to be lost.
The phase diagram for this aircraft's mission might be configured as shown in the following picture, where each phase block is linked to the RBD that describes the reliability-wise configuration of the aircraft during that activity.
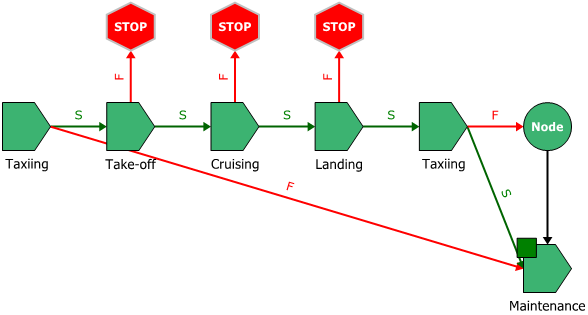
Each of the operational phases in this diagram has two paths leading from it: a success path and a failure path. This graphically illustrates the consequences in each case. For instance, if the first taxiing phase is successful, the airplane will proceed to the take-off phase; if it is unsuccessful, the airplane will be sent for maintenance. The failure paths for the take-off, cruising and landing phases point to stop blocks, which indicate that the simulation of the mission ends. For the final taxiing phase, both the success and failure paths lead to the maintenance path; the node block allows you to model this type of shared outcome.
The following table summarizes the operational phases and their properties. By applying a duty cycle of 1.5, the take-off and landing phases show that the system will operate at a 50% greater rate than the taxiing and cruising phases. (For more information, see Operational Phase Blocks: Duty Cycles.) The On System Failure column shows what will happen if a failure occurs during that phase. For example, if there is a system failure during the take-off, the simulation will end (indicating that the system will be lost) and a new simulation will begin. Whereas, if the system failure occurs during the taxiing phase, the system will enter a maintenance phase and may be able to resume the mission when the repairs are complete.
|
Phase Name |
Duration |
Duty Cycle |
On System Failure |
|
Taxiing |
15 minutes |
1 |
Go to the maintenance phase |
|
Take-off |
30 seconds |
1.5 |
End current simulation, start new simulation if applicable |
|
Cruising |
4 hours |
1 |
End current simulation, start new simulation if applicable |
|
Landing |
30 seconds |
1.5 |
End current simulation, start new simulation if applicable |
|
Taxiing |
10 minutes |
1 |
Go to the maintenance phase |
When you simulate the phase diagram, the software will simulate the RBD linked to the Taxiing phase block for the specified period of time and then simulate the RBD linked to the Take-off phase, and so on according to the instructions in the phase diagram.
Most of the techniques for working with objects in a phase diagram, such as selecting blocks within the diagram, copying/pasting blocks and arranging blocks, are the same as the options described for RBDs and fault trees. For information on modifying appearance settings, see Diagram Skins and Appearance Settings.
The ReliaWiki resource portal has more information on phase diagrams at: http://www.reliawiki.org/index.php/Reliability_Phase_Diagrams_(RPDs).