Median Rank for Single Censored Data

|
This example validates the median rank calculations for complete data in Weibull++ standard folios.
Reference Case
Table 6.2 on page 283 in the book Reliability Engineering Handbook Vol 1 by Dr. Kececioglu, Prentice-Hall, 1991.
Data
| Num. In Stage | State F or S | Time to Failure |
|---|---|---|
| 1 | F | 16 |
| 1 | F | 34 |
| 1 | F | 53 |
| 1 | F | 75 |
| 1 | F | 93 |
| 1 | F | 120 |
| 4 | S | 200 |
Result
| Num. In Stage | State F or S | Time to Failure | Median Rank (%) |
|---|---|---|---|
| 1 | F | 16 | 6.7 |
| 1 | F | 34 | 16.23 |
| 1 | F | 53 | 25.86 |
| 1 | F | 75 | 35.51 |
| 1 | F | 93 | 45.17 |
| 1 | F | 120 | 54.83 |
| 4 | S | 200 |
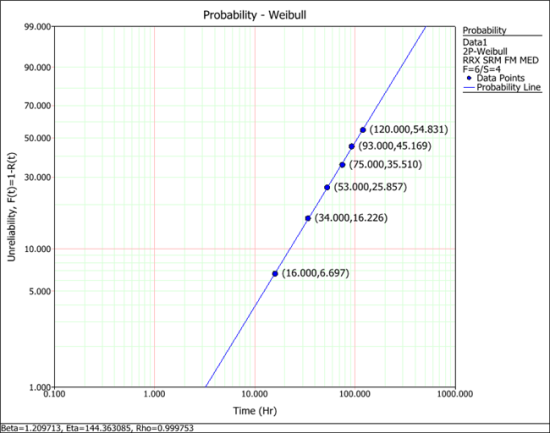
Results in Weibull++
The coordinates of each point in the following plot shows the failure time and the corresponding median rank.