Median Rank for Multiple Censored Data
This example validates the median rank calculation for multiple censored data in Weibull++ standard folios.
Reference Case
Table 3.1 on page 78 in the book Reliability & Life Testing Handbook Vol 2 by Dr. Kececioglu, Prentice-Hall, 1994.
Data
| Num. In Stage | State F or S | Time to Failure |
|---|---|---|
| 1 | F | 5100 |
| 1 | S | 9500 |
| 1 | F | 15000 |
| 1 | S | 22000 |
| 1 | F | 40000 |
Result
| Num. In Stage | State F or S | Time to Failure | Median Rank (%) |
|---|---|---|---|
| 1 | F | 5100 | 12.94 |
| 1 | S | 9500 | |
| 1 | F | 15000 | 36.1 |
| 1 | S | 22000 | |
| 1 | F | 40000 | 70.84 |
Results in Weibull++
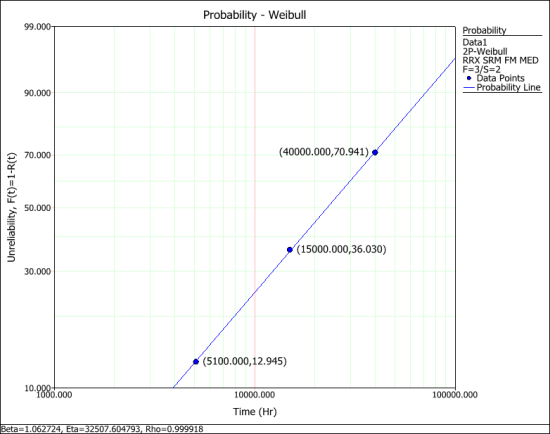
The coordinates of each point in the following plot shows the failure time and the corresponding median rank.
The differences between the results in Weibull++ and the book are due to the method of calculating the median ranks (MR). In the book, the following approximation method is used:
where is the median rank at the
failure time;
is the mean order number;
is the total samples. For the step by step calculation of mean order number (MON), please refer to the book “Reliability & Life Testing Handbook Vol 2” by Dr. Kececioglu, Prentice-Hall, 1994.
In Weibull++, the following exact method is used:
where is the 50 percentile of a F distribution with degree of freedom of
m and n.

