Degradation Data Analysis with a Power Regression Model

|
This example validates the results for a degradation analysis with a power regression model in Weibull++ degradation folios.
Reference Case
The data set is from Example 8.1 on page 336 in the book Life Cycle Reliability Engineering by Dr. Guangbin Yang, John Wiley & Sons, 2007.
Data
The following table shows the percent transconductance degradation data taken at different times for five units of a MOS field-effect transistor. The failure criterion is defined as a degradation greater than or equal to 15%.
| Time | 1 | 2 | 3 | 4 | 5 |
|---|---|---|---|---|---|
| 100 | 1.05 | 0.58 | 0.86 | 0.6 | 0.62 |
| 200 | 1.4 | 0.9 | 1.25 | 0.6 | 0.64 |
| 300 | 1.75 | 1.2 | 1.45 | 0.6 | 1.25 |
| 400 | 2.1 | 1.75 | 1.75 | 0.9 | 1.3 |
| 500 | 2.1 | 2.01 | 1.75 | 0.9 | 0.95 |
| 600 | 2.8 | 2 | 2 | 1.2 | 1.25 |
| 700 | 2.8 | 2 | 2 | 1.5 | 1.55 |
| 800 | 2.8 | 2 | 2 | 1.5 | 1.9 |
| 900 | 3.2 | 2 | 2.3 | 1.5 | 1.25 |
| 1000 | 3.4 | 2.3 | 2.3 | 1.7 | 1.55 |
| 1200 | 3.8 | 2.6 | 2.6 | 2.1 | 1.5 |
| 1400 | 4.2 | 2.9 | 2.8 | 2.1 | 1.55 |
| 1600 | 4.2 | 3.2 | 3.15 | 1.8 | 1.9 |
| 1800 | 4.5 | 3.6 | 3.2 | 2.1 | 1.85 |
| 2000 | 4.9 | 3.8 | 3.2 | 2.1 | 2.2 |
| 2500 | 5.6 | 4.2 | 3.8 | 2.4 | 2.2 |
| 3000 | 5.9 | 4.4 | 3.8 | 2.7 | 2.5 |
| 3500 | 6.3 | 4.8 | 4 | 2.7 | 2.2 |
| 4000 | 6.6 | 5 | 4.2 | 3 | 2.8 |
| 4500 | 7 | 5.6 | 4.4 | 3 | 2.8 |
| 5000 | 7.8 | 5.9 | 4.6 | 3 | 2.8 |
| 6000 | 8.6 | 6.2 | 4.9 | 3.6 | 3.1 |
| 7000 | 9.1 | 6.8 | 5.2 | 3.6 | 3.1 |
| 8000 | 9.5 | 7.4 | 5.8 | 4.2 | 3.1 |
| 9000 | 10.5 | 7.7 | 6.1 | 4.6 | 3.7 |
| 10000 | 11.1 | 8.4 | 6.3 | 4.2 | 4.4 |
| 12000 | 12.2 | 8.9 | 7 | 4.8 | 3.7 |
| 14000 | 13 | 9.5 | 7.2 | 5.1 | 4.4 |
| 16000 | 14 | 10 | 7.6 | 4.8 | 4.4 |
| 18000 | 15 | 10.4 | 7.7 | 5.3 | 4.1 |
| 20000 | 16 | 10.9 | 8.1 | 5.8 | 4.1 |
| 25000 | 18.5 | 12.6 | 8.9 | 5.7 | 4.7 |
| 30000 | 20.3 | 13.2 | 9.5 | 6.2 | 4.7 |
| 35000 | 22.1 | 15.4 | 11.2 | 8 | 6.4 |
| 40000 | 24.2 | 18.1 | 14 | 10.9 | 9.4 |
Note: The results provided here were done with the "Use unbiased Std on Normal data" option set to No.
Result
In the book, the following equation is used:
 . It in fact is a power equation
 with
with
 and
and
 . This degradation equation is used for each test unit to predict the pseudo failure time, and then a lognormal distribution is used to model the pseudo failure times. The results are:
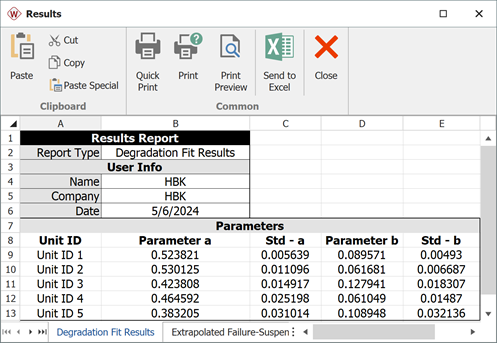
- The parameters of the power regression model for each unit are:
-
- For unit 1:
 = -2.413 ,
 = 0.524
 - For unit 2:
 = -2.735 ,
 = 0.525
 - For unit 3:
 = -2.056 ,
 = 0.424
 - For unit 4:
 = -2.796 ,
 = 0.465
 - For unit 5:
 = -2.217 ,
 = 0.383
- For unit 1:
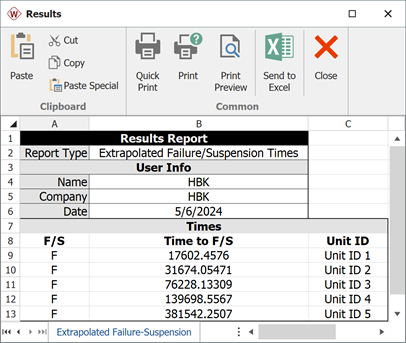
- The predicted pseudo failure times are: 17,602; 31,674; 76,228; 139,698; 381,542.
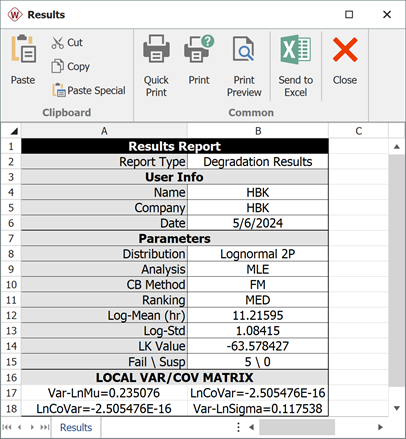
- The parameters of the fitted lognormal distribution are: Ln-Mean = 11.214, Ln-Std = 1.085.
Results in Weibull++
- The following picture shows the parameters of the power regression model for each unit.
- The predicted pseudo failure times are shown next.
- The next picture shows the parameters of the fitted lognormal distribution.