Competing Failure Modes
This example validates the competing failure mode calculations in Weibull++ standard folios.
Reference Case
The data set is from Table 15.1 on page 383 in the book Statistical Methods for Reliability Data by Dr. Meeker and Dr. Escobar, John Wiley & Sons, 1998.
Data
| State F/S | Time to F/S | Failure Mode |
|---|---|---|
| F | 275 | w |
| F | 13 | s |
| F | 147 | w |
| F | 23 | s |
| F | 181 | w |
| F | 30 | s |
| F | 65 | s |
| F | 10 | s |
| S | 300 | |
| F | 173 | s |
| F | 106 | s |
| S | 300 | |
| S | 300 | |
| F | 212 | w |
| S | 300 | |
| S | 300 | |
| S | 300 | |
| F | 2 | s |
| F | 261 | s |
| F | 293 | w |
| F | 88 | s |
| F | 247 | s |
| F | 28 | s |
| F | 143 | s |
| S | 300 | |
| F | 23 | s |
| S | 300 | |
| F | 80 | s |
| F | 245 | w |
| F | 266 | w |
Result
In the book, parameters and
are used for the Weibull distribution. They are defined by
and
. The results are:
- For failure mode s, the log-likelihood value is -101.36.
- For failure mode s,
= 6.11 and its approximated 95% confidence interval are [5.27, 6.95].
- For failure mode s,
= 1.49 and its approximated 95% confidence interval are [0.94, 2.36].
- For failure mode w, the log-likelihood value is -47.16.
- For failure mode w,
= 5.83 and its approximated 95% confidence interval are [5.62, 6.04].
- For failure mode w,
= 0.23 and its approximated 95% confidence interval are [0.12, 0.44].
Results in Weibull++
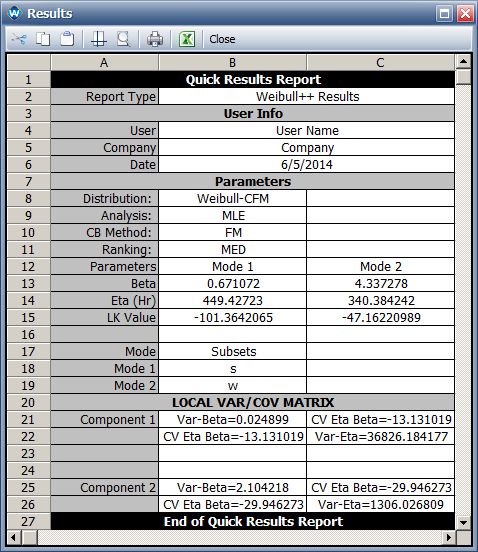
- The following picture shows the ML estimates and the variance covariance matrix for each failure mode.
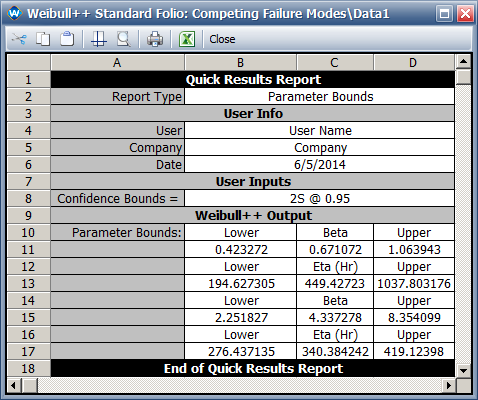
- The following picture shows the 95% confidence intervals for the parameters of each failure mode.
- In terms of
and
, the results are:
-
- For failure mode s,
= 6.11 and its approximated 95% confidence interval are [5.27, 6.95].
- For failure mode s,
= 1.49 and its approximated 95% confidence interval are [0.94, 2.36].
- For failure mode w,
= 5.83 and its approximated 95% confidence interval are [5.62, 6.04].
- For failure mode w,
= 0.23 and its approximated 95% confidence interval are [0.12, 0.44].
- For failure mode s,
The above results are exactly the same as the results in the book.


