Test-Fix-Find-Test Data Reference Example
This example validates the results for test-fix-find-test data in Weibull++ Reliability Growth data folios.
Reference Case
MIL-HDBK-189A, Section 7.5.2, pg. 206, 2009.
For this example, the following will be calculated:
- Parameters of the Crow Extended model
- Demonstrated MTBF (DMTBF)
- BD mode parameters
- Projected MTBF (PMTBF)
Data
The following table shows the data.
| Failure Time | Classification Mode |
|---|---|
| 0.7 | BC1 |
| 3.7 | BC1 |
| 13.2 | BC1 |
| 15 | BD1 |
| 17.6 | BC2 |
| 25.3 | BD2 |
| 47.5 | BD3 |
| 54 | BD4 |
| 54.5 | BC3 |
| 56.4 | BD5 |
| 63.6 | A |
| 72.2 | BD5 |
| 99.2 | BC4 |
| 99.6 | BD6 |
| 100.3 | BD7 |
| 102.5 | A |
| 112 | BD8 |
| 112.2 | BC5 |
| 120.9 | BD2 |
| 121.9 | BC6 |
| 125.5 | BD9 |
| 133.4 | BD10 |
| 151 | BC7 |
| 163 | BC8 |
| 164.7 | BD9 |
| 174.5 | BC9 |
| 177.4 | BD10 |
| 191.6 | BC10 |
| 192.7 | BD11 |
| 213 | A |
| 244.8 | A |
| 249 | BD12 |
| 250.8 | A |
| 260.1 | BD1 |
| 263.5 | BD8 |
| 271.1 | A |
| 274.7 | BD6 |
| 282.8 | BC11 |
| 285 | BD13 |
| 304 | BD9 |
| 315.4 | BD4 |
| 317.1 | A |
| 320.6 | A |
| 324.5 | BD12 |
| 324.9 | BD10 |
| 342 | BD5 |
| 350.2 | BD3 |
| 355.2 | BC12 |
| 364.6 | BD10 |
| 364.9 | A |
| 366.3 | BD2 |
| 373 | BD8 |
| 379.4 | BD14 |
| 389 | BD15 |
| 394.9 | A |
| 395.2 | BD16 |
| BD Mode | EF |
|---|---|
| 1 | 0.67 |
| 2 | 0.72 |
| 3 | 0.77 |
| 4 | 0.77 |
| 5 | 0.77 |
| 6 | 0.87 |
| 7 | 0.92 |
| 8 | 0.50 |
| 9 | 0.85 |
| 10 | 0.89 |
| 11 | 0.70 |
| 12 | 0.63 |
| 13 | 0.64 |
| 14 | 0.72 |
| 15 | 0.69 |
| 16 | 0.46 |
Result
The book has the following results:
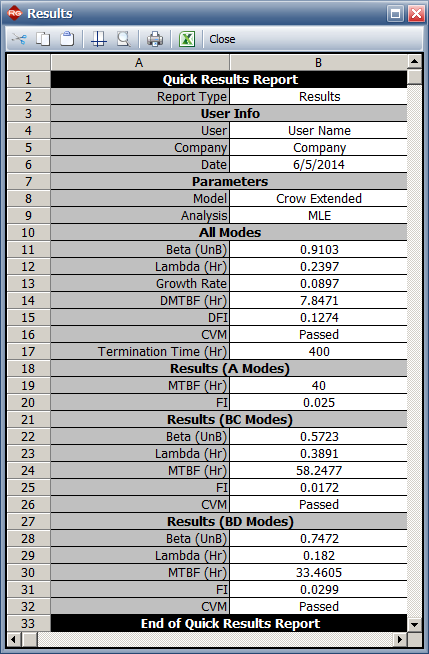
- Beta = 0.9103, Lambda = 0.2397
- DMTBF = 7.84 hours
- BD Mode Parameters: Beta = 0.7472, Lambda = 0.1820
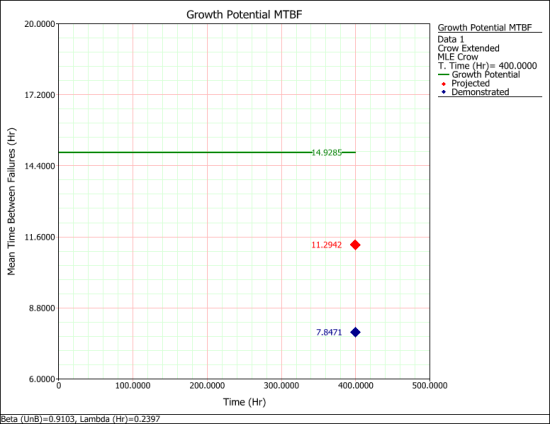
- PMTBF = 11.29 hours
Results in Weibull++
In Weibull++, the Crow Extended model with the maximum likelihood estimation (MLE) method was used to calculate the results.
- The model parameters are:
- The PMTBF is 11.29 hours, as shown in the plot:


