Test-Find-Test Data Reference Example
This example validates the results for test-find-test data in Weibull++ Reliability Growth data folios.
Reference Case
International Standard IEC 61164 (Reliability Growth in Product Design and Test – Statistical Test and Estimation Methods), Example 4, pg. 32.
For this example, the following will be calculated:
- Parameters of the Crow Extended model
- Unseen BD mode failure intensity
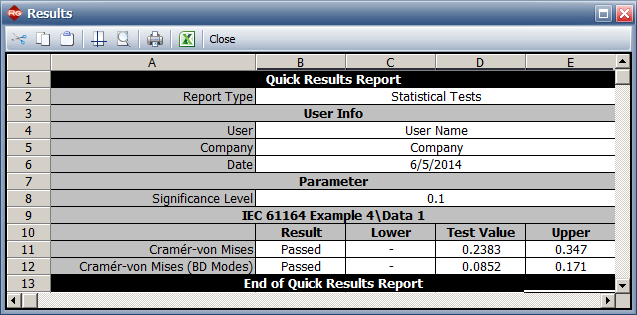
- Cramér-von Mises (CVM) goodness of fit for BD modes
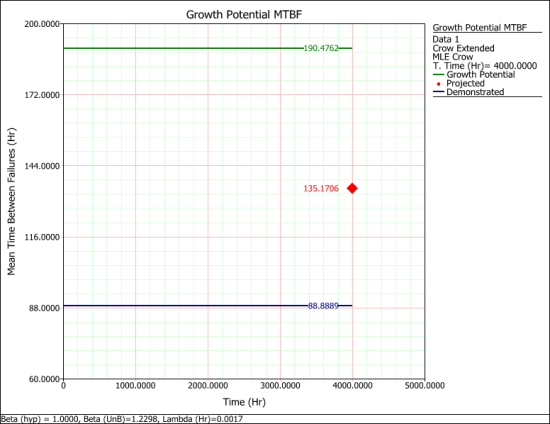
- Demonstrated MTBF (DMTBF)
- Projected PMTBF (PMTBF)
Data
The following table shows the data.
| Failure Time | Classification Mode |
|---|---|
| 150 | BD1 |
| 253 | BD2 |
| 475 | BD3 |
| 540 | BD4 |
| 564 | BD5 |
| 636 | A |
| 722 | BD5 |
| 871 | A |
| 996 | BD6 |
| 1003 | BD7 |
| 1025 | A |
| 1120 | BD8 |
| 1209 | BD2 |
| 1255 | BD9 |
| 1334 | BD10 |
| 1647 | BD9 |
| 1774 | BD10 |
| 1927 | BD11 |
| 2130 | A |
| 2214 | A |
| 2293 | A |
| 2448 | A |
| 2490 | BD12 |
| 2508 | A |
| 2601 | BD1 |
| 2635 | BD8 |
| 2731 | A |
| 2747 | BD6 |
| 2850 | BD13 |
| 3040 | BD9 |
| 3154 | BD4 |
| 3171 | A |
| 3206 | A |
| 3245 | DB12 |
| 3249 | BD10 |
| 3420 | BD5 |
| 3502 | BD3 |
| 3646 | BD10 |
| 3649 | A |
| 3663 | BD2 |
| 3730 | BD8 |
| 3794 | BD14 |
| 3890 | BD15 |
| 3949 | A |
| 3952 | BD16 |
| BD Mode | EF |
|---|---|
| 1 | 0.7 |
| 2 | 0.7 |
| 3 | 0.8 |
| 4 | 0.8 |
| 5 | 0.9 |
| 6 | 0.9 |
| 7 | 0.5 |
| 8 | 0.8 |
| 9 | 0.9 |
| 10 | 0.7 |
| 11 | 0.7 |
| 12 | 0.6 |
| 13 | 0.6 |
| 14 | 0.7 |
| 15 | 0.7 |
| 16 | 0.5 |
Result
The book has the following results:
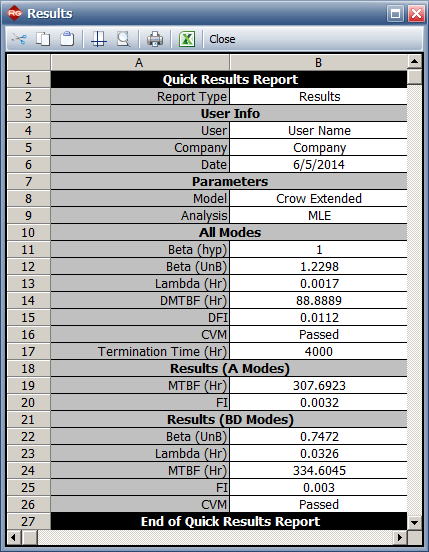
- BetaBD (UnB) = 0.7472, LambdaBD = 0.0326
- Unseen BD Mode Failure Intensity = 0.0030/hr
- Goodness of fit for BD modes: CVM = 0.085, critical value = 0.171 with significance level = 0.1. Since CVM < critical value can fail to reject hypothesis that the model fits the data.
- DMTBF = 88.9 hours
- PMTBF = 135.1 hours
Results in Weibull++
In Weibull++, the Crow Extended model with the maximum likelihood estimation (MLE) method was used to calculate the results.
For a test-find-test, the assumption is . Therefore:
- The model parameters are:
- The growth potential MTBF plot:


