Repairable Systems Analysis Reference Example

|
This example validates the results for a repairable systems analysis in Weibull++ Reliability Growth data folios.
Reference Case
Crow, L.H., Reliability Analysis for Complex Repairable Systems, Reliability and Biometry: Statistical Analysis of Lifelength, pg. 385, 1974.
For this example, the Power Law model parameters will be calculated.
Data
The following table shows the data.
| System 1 | System 2 | System 3 |
|---|---|---|
| 4.3 | 0.1 | 8.4 |
| 4.4 | 5.6 | 32.4 |
| 10.2 | 18.6 | 44.7 |
| 23.5 | 19.5 | 48.4 |
| 23.8 | 24.2 | 50.6 |
| 26.4 | 26.7 | 73.6 |
| 74 | 45.1 | 98.7 |
| 77.1 | 45.8 | 112.2 |
| 92.1 | 72.7 | 129.8 |
| 197.2 | 75.7 | 136 |
| 98.6 | 195.8 | |
| 120.1 | ||
| 161.8 | ||
| 180.6 | ||
| 190.8 |
Result
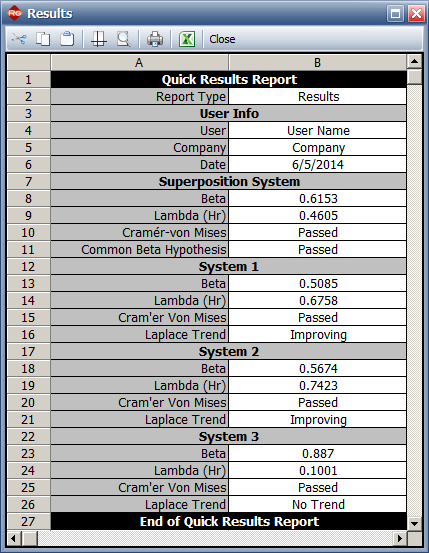
The book has the following results:
Beta = 0.615, Lambda = 0.461
Results in Weibull++
Since  and
and
 then the maximum likelihood estimates of
 and
and
 are given by:


The model parameters are: