Optimal Test Plan for Two Stresses

|
This example validates the results for the 3 level optimum test plan with two stresses in Weibull++.
Reference Case
The data set is from Example 20.8 on page 549 in the book Statistical Methods for Reliability Data by Dr. Meeker and Dr. Escobar, John Wiley & Sons, 1998.
Data
A Weibull distribution with the following life-stress relationship is used.

where temp is the temperature in Kelvins and vpm is the voltage stress in volts/mm. The planning values for the model parameters for the test plan are:
-
 ,
,
 ,
,
 and
and

These planning values are given on page 535.
The use condition stress values are vpm = 80 volts/mm and temp = 120°C (393.15°K).
The highest stress values that can be used in the test are: vpm = 200 volts/mm and temp = 260°C (533.15°K).
A total of 170 units will tested for 1,000 hours. Three combinations of temperature and voltage levels can be used in the test. The objectives of the test plan are to:
- Determine the three stress combinations that should be used in the test.
- Determine the number of test units at each stress combination.
Tests will be conducted using the created test plan. The failure data from the test will be used to estimate the model parameters, which are then used to predict the B10 life at vpm = 80 volts/mm and temp = 120°C. Therefore, we need a test plan that will minimize the estimation variance of the B10 life at the given usage stress level.
Result
The three stress combinations and the number of test units at each of them are:
-
- 62 units should be tested at 124 volts and 260°C (533.15°K)
- 42 units should be tested at 159 volts and 120°C (393.15°K)
- 66 units should be tested at 200 volts and 260°C (533.15°K)
Based on this test plan, the estimated standard error for the B10 life at vpm = 80 volts/mm and temp = 120°C is
 = 0.3670 .
The standard error is calculated from the result in Table 20.6, as shown next:

Since n = 170 and  = 2.205229, so
 = 0.1347. Therefore,
 = 0.3670.
Results in Weibull++
The planning information is entered in Weibull++, as shown below.
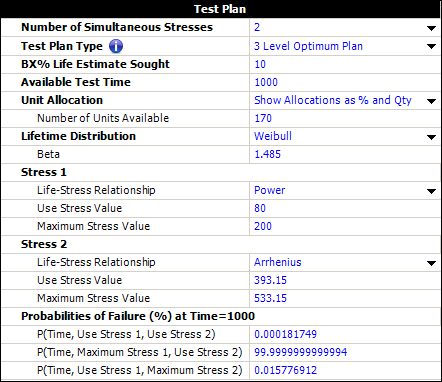
The probabilities of failure (%) at time 1000 are calculated based on the test planning values. For example, at the use stress of voltage and at the maximum stress of temperature, the life characteristic is:

Therefore,  = 363269. The probability of failure is calculated by:

The resulting test plan in Weibull++ is shown below.
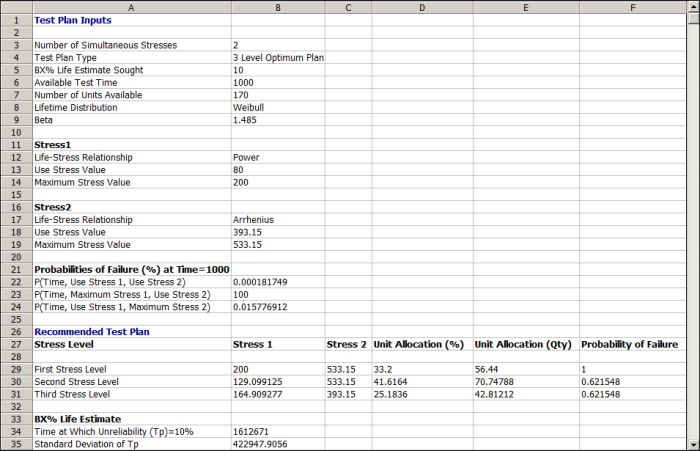
The test plan shows that (starting at row 29 in the picture above):
- The first stress level should be a combination of 200 volts and 260°C (533.15°K) and about 56 units should be tested at that level.
- The second stress level should be a combination of 129 volts and 260°C (533.15°K) and about 71 units should be tested at that level.
- The third stress level (row 31) should be a combination of 165 volts and 120°C (393.15°K) and about 43 units should be tested at that level.
The estimated standard deviation of the log B10 life at 50°C can be obtained by:

The above results are different from the results given in the book. In the following discussion, a simulation study is conducted to check the results obtained from Weibull++.
Using SimuMatic to Evaluate the Test Plan
We will use the Stress-Dependent SimuMatic utility to evaluate the test plan. The following picture shows the settings used in the Main tab of SimuMatic (with
 ):
):
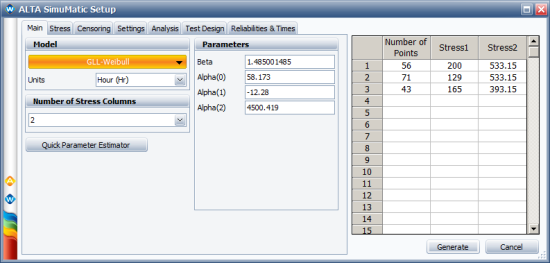
The rest of the settings in SimuMatic are as follows:
- Stress tab:
-
- Use level = 80, Transformation = Logarithmic
- Use level = 393.15, Transformation = Reciprocal
- Censoring tab:
-
- Right censoring after time 1000.
- Settings tab
-
- Seed = 10, Precision = 4, Number of data sets = 1000
- Reliabilities and Times tab
-
- Reliability value = 0.9
The simulation results are shown next.
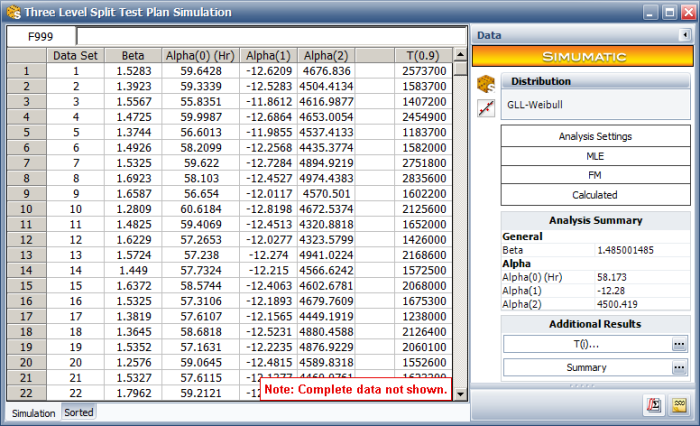
We take the natural log of the B10 life (the last column) and calculate its standard deviation. The calculated standard deviation is 0.2629. This is very close to the analytical solution from the test plan tool, where the standard deviation is 0.2623.
This standard deviation is smaller than the standard deviation given by the test plan in the book. Therefore, the test plan generated in Weibull++ is better than the test plan given in the book in terms of minimizing the estimation variance of the B10 life.