Arrhenius-Lognormal Model for Interval Data with Activation Energy

|
This example validates the results for the Arrhenius-lognormal model for interval data, with a given activation energy.
Reference Case
The data set is from Example 19.11 on page 508 in the book Statistical Methods for Reliability Data by Dr. Meeker and Dr. Escobar, John Wiley & Sons, 1998.
Data
The data set for a new-technology IC Device is given below.
| Number in Group | Last Inspected (Hr) | State F/S | Time to State | Temperature (K) |
|---|---|---|---|---|
| 50 | 788 | S | 1536 | 423.15 |
| 50 | 788 | S | 1536 | 448.15 |
| 50 | 96 | S | 96 | 473.15 |
| 1 | 384 | F | 788 | 523.15 |
| 3 | 788 | F | 1536 | 523.15 |
| 5 | 1536 | F | 2304 | 523.15 |
| 41 | 1536 | S | 2304 | 523.15 |
| 4 | 192 | F | 384 | 573.15 |
| 27 | 384 | F | 788 | 573.15 |
| 16 | 788 | F | 1536 | 573.15 |
| 3 | 788 | S | 1536 | 573.15 |
Result
The following function is used for the Ln-Mean
 of the lognormal distribution:

where T is the temperature;  is the activation energy; and 11605 is calculated from the reciprocal of the Boltzmann constant. This function can be written in the following way:

The above equation is the general log-linear model in Weibull++. In Weibull++, the coefficients are denoted by
 . We can see
 and
and
 .
.
In fact, the above model can also be expressed using the traditional Arrhenius model:

In the book, the activation energy is assumed to be known. So
 , or
, or
 .
.
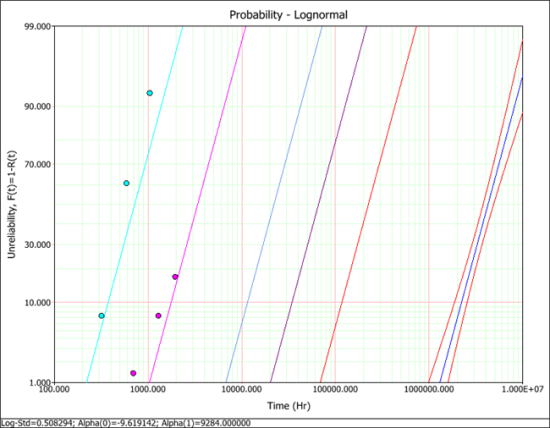
No results are provided in the book. Only the probability plot is given in Figure 19.15. The plot shows that the confidence interval for the reliability at the use stress of 100°C is very narrow.
Results in Weibull++
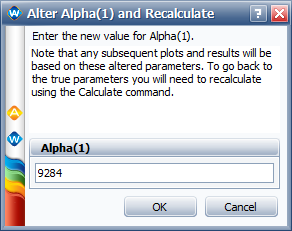
We can use the "Alter One Parameter (and Recalculate)" utility in Weibull++ to enter the value for
 = 9284, as shown next.
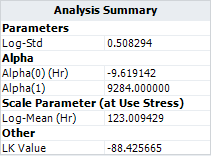
The following picture shows the results.
The probability plot with confidence interval at the use temperature level is shown next. This plot is similar to the plot shown in the book. The confidence interval for the reliability at the use stress level (the line at the far right side of the plot) is very tight since the activation energy is given.