Arrhenius-Lognormal Model

|
This example validates the results for the Arrhenius life stress relationship with a Lognormal distribution in Accelerated Life Testing (ALTA) life-stress data folios.
Reference Case
The data set is from Example 19.5 on page 498 in book Statistical Methods for Reliability Data by Dr. Meeker and Dr. Escobar, John Wiley & Sons, 1998.
Data
Device A was tested under several different temperature settings. The following table shows the data.
| Number in Group | State F/S | Time to State | Temperature (°F) | Subset ID |
|---|---|---|---|---|
| 30 | S | 5000 | 283.15 | 1 |
| 1 | F | 1298 | 313.15 | 2 |
| 1 | F | 1390 | 313.15 | 2 |
| 1 | F | 3187 | 313.15 | 2 |
| 1 | F | 3241 | 313.15 | 2 |
| 1 | F | 3261 | 313.15 | 2 |
| 1 | F | 3313 | 313.15 | 2 |
| 1 | F | 4501 | 313.15 | 2 |
| 1 | F | 4568 | 313.15 | 2 |
| 1 | F | 4841 | 313.15 | 2 |
| 1 | F | 4982 | 313.15 | 2 |
| 90 | S | 5000 | 313.15 | 2 |
| 1 | F | 581 | 333.15 | 3 |
| 1 | F | 925 | 333.15 | 3 |
| 1 | F | 1432 | 333.15 | 3 |
| 1 | F | 1586 | 333.15 | 3 |
| 1 | F | 2452 | 333.15 | 3 |
| 1 | F | 2734 | 333.15 | 3 |
| 1 | F | 2772 | 333.15 | 3 |
| 1 | F | 4106 | 333.15 | 3 |
| 1 | F | 4674 | 333.15 | 3 |
| 11 | S | 5000 | 333.15 | 3 |
| 1 | F | 283 | 353.15 | 4 |
| 1 | F | 361 | 353.15 | 4 |
| 1 | F | 515 | 353.15 | 4 |
| 1 | F | 638 | 353.15 | 4 |
| 1 | F | 854 | 353.15 | 4 |
| 1 | F | 1024 | 353.15 | 4 |
| 1 | F | 1030 | 353.15 | 4 |
| 1 | F | 1045 | 353.15 | 4 |
| 1 | F | 1767 | 353.15 | 4 |
| 1 | F | 1777 | 353.15 | 4 |
| 1 | F | 1856 | 353.15 | 4 |
| 1 | F | 1951 | 353.15 | 4 |
| 1 | F | 1964 | 353.15 | 4 |
| 1 | F | 2884 | 353.15 | 4 |
| 1 | S | 5000 | 353.15 | 4 |
Result
The following function is used for the Ln-Mean
 :
:

where T is the temperature;  is the activation energy;
 is from the reciprocal of the Boltzmann constant. This function can be written in the following way:

The above equation is the general log-linear model in Weibull++. In Weibull++, the coefficients are denoted by
 .
.
In fact, the above model also can be expressed using the traditional Arrhenius model:

In the book, the following results are provided:
- ML estimations for the model parameters are:
 ,
,
 ,
,
 (or
(or
 ).
).
- The 95% confidence interval for
 is [0.75, 1.28], for
 is [-19.1, -7.8] and for
 is [0.47, 0.79].
- The variance/covariance matrix for
 ,
,
 and
and
 is:
is:

- In terms of
 ,
,
 and
and
 , the variance/covariance matrix is:

- The log-likelihood value is -321.7.
Results in Weibull++
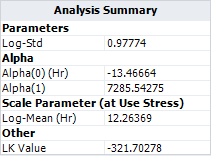
- ML estimations for the model parameters are:
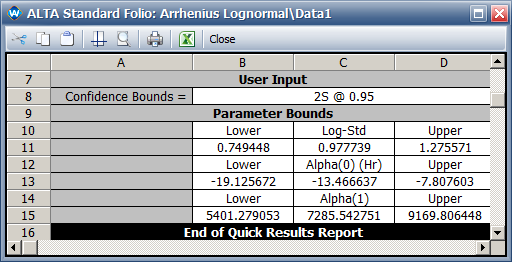
- The 95% confidence intervals are:
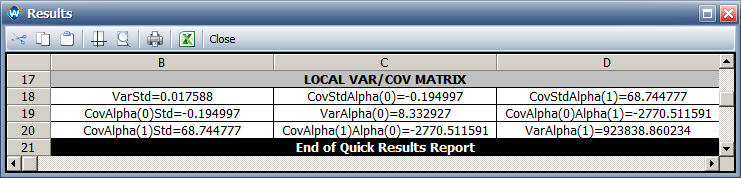
The variance/covariance matrix for  ,
,
 and
and
 is:
is:
- The log-likelihood value is -321.7.
It can be seen that all the results in Weibull++ are very close to the results in the book.