Can the Likelihood Value be Greater Than 0?
[Editor's Note: This article has been updated since its original publication to reflect a more recent version of the software interface.]
ReliaSoft's Weibull++ and ALTA software packages provide the option to use the Maximum Likelihood Estimation (MLE) parameter estimation method. With this method, the set of values that maximize the likelihood function is used as the estimated parameters for the distribution. Many reliability engineers have the impression that the natural logarithm of the likelihood function (Ln-likelihood) is always negative, or in other words, that the likelihood value should always be less than 0. However, this is not true. In this article, we will explain the reason why the Ln-likelihood function can be greater than 0.
Theoretical Background
Let x be a continuous random variable, for instance the failure time, with a probability density function (pdf) expressed as:
![]()
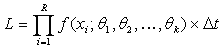
where θ1, θ2, , θk are the k unknown parameters that need to be estimated and x1, x2, , xR are the R independent observed failure times. This type of failure data is called "complete failure data." The likelihood function for complete failure data is given by: [1]
|
|
(1) |

The Ln-likelihood function is given by:
|
|
(2) |
To understand Eqn. (1), one needs to look at the original meaning of the pdf and the likelihood function. The likelihood function is a probability function that gives the probability that the given failure data can be observed. However, is Eqn. (1) a probability function? Actually, it is a simplified equation that neglects a small time interval Δt (close to 0).[2] For a given time, t, the probability that a failure occurs in a very small interval around t is:
![]()
The following plot gives a graphical illustration of the above equation.

Figure 1: pdf Plot with a Small Time Interval
The area under the pdf curve within the interval Δt is the probability that an event occurs around time t. Therefore, the "true" likelihood function for a data set is:
Δt has no effect on the final parameter estimation in MLE because it can be treated as a constant value. Thus, it is usually omitted in the likelihood function. It is this simplified version of the function that is given in Eqn. (1) above.
The product
![]() is the probability that failure occurs within a small interval
around time xi,
therefore it is a value between 0 and 1. However, the pdf
function
is the probability that failure occurs within a small interval
around time xi,
therefore it is a value between 0 and 1. However, the pdf
function
![]() can be greater than 1. Thus, Eqn. (1) can have a value greater
than 1, which causes the Ln-likelihood function of Eqn. (2) to
be greater than 0. In
Weibull++ and ALTA, values of Eqn. (2) are given
as the "LK Values" in the results.
can be greater than 1. Thus, Eqn. (1) can have a value greater
than 1, which causes the Ln-likelihood function of Eqn. (2) to
be greater than 0. In
Weibull++ and ALTA, values of Eqn. (2) are given
as the "LK Values" in the results.
When performing maximum likelihood analysis on data with censored items, the likelihood function is expanded. Extra terms are added to the likelihood function to account for the censored data. The likelihood function is formulated as:
|
(3) |

where:
-
 is for complete failure data.
 -
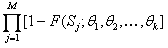 is for right censored data.
 -
 is for interval and left censored data.[1]
Eqn. (3) is also a simplified form
because the small time
Δt
is removed for the complete data type. Since
![]() can be greater than 1, the value of L
can be greater than 1.
can be greater than 1, the value of L
can be greater than 1.
From the above equation, we can see that in the likelihood function, the probability functions of censored data are expressed in terms of the cumulative distribution function (cdf) and those of complete data are expressed in terms of the probability density function (pdf). The pdf of complete data may be greater than 1, which may cause the whole equation to have a value greater than 1.
Example 1
The exponential distribution is used to analyze the data set in Table 1. Figure 2 gives the results.
Table 1: Complete Failure Data
|
State F or S |
Time to State |
|
F |
0.06 |
|
F |
0.09 |
|
F |
0.1 |
|
F |
0.2 |
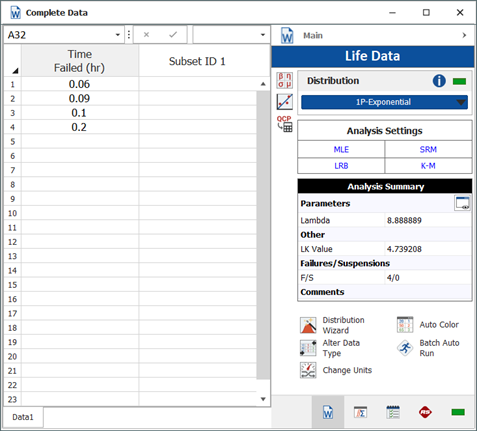
Figure 2: Data with Positive
Ln-likelihood Value
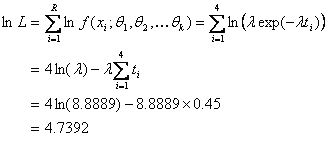
The calculated Ln-likelihood value of 4.7392 is shown in the figure above. It can be obtained using the estimated value of the parameter λ and Eqn. (2):
Example 2
If 20 additional units were tested, all of which were suspended at time = 0.25, then the data in Table 1 becomes:
Table 2: Failure Data with
Right Censoring
|
Number in State |
State F or S |
Time to State |
|
1 |
F |
0.06 |
|
1 |
F |
0.09 |
|
1 |
F |
0.1 |
|
1 |
F |
0.2 |
|
20 |
S |
0.25 |
Figure 3 shows the MLE results for Table 2.
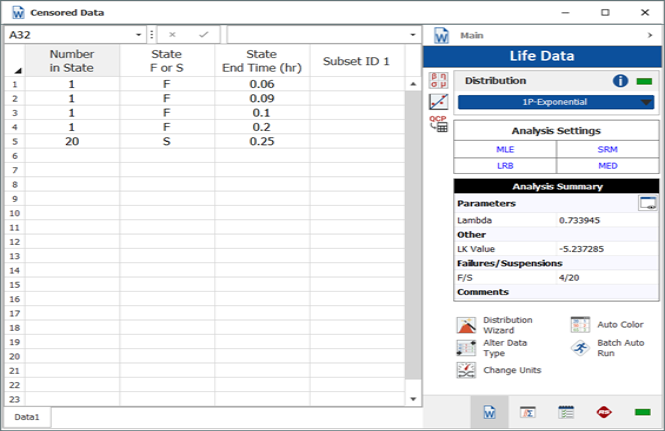
Figure 3: Data with a Negative Ln-Likelihood Value
Figure 3 shows that the Ln-likelihood value becomes negative, which means the "likelihood" value is less than 1.
Conclusions
In this article, we explained why the Ln-likelihood value in Weibull++ and ALTA can be positive. Examining the theoretical background of the likelihood function and the pdf makes the reason clear: The so called "likelihood" function is actually a modified likelihood function. The pdf terms in the function can cause the likelihood value be any positive value. So, it is not surprising to see a positive Ln-likelihood value.
References
[1] ReliaSoft
Corporation,
Life Data (Weibull) Analysis Reference, Tucson: ReliaSoft
Publishing, 2008.
[2] Meeker, W. Q. and Escobar, L. A.,
Statistical Methods for Reliability Data, New York: John
Wiley & Sons, 1998.