Minimal Cut Sets
[Editor's Note: This article has been updated since its original publication to reflect a more recent version of the software interface.]
Traditional solution of reliability block diagrams and fault trees involves the determination of the so-called minimal cut sets. Cut sets are the unique combinations of component failures that can cause system failure. Specifically, a cut set is said to be a minimal cut set if, when any basic event is removed from the set, the remaining events collectively are no longer a cut set [1].
Minimal cut sets have traditionally been used to obtain an estimate of reliability for complex reliability block diagrams (RBDs) or fault trees that can not be simplified by a combination of the simple constructs (parallel, series, k-out-of-n). BlockSim has the capability to derive an exact analytical solution to complex diagrams and therefore does not utilize the cut sets methodology. Cut sets are provided in BlockSim for interested users. They can be obtained for both fault trees and block diagrams by choosing Analysis > Tools > Show Cut Sets.
Minimal cut sets can be used to understand the structural vulnerability of a system. The longer a minimal cut set is, the less vulnerable the system (or top event in fault trees) is to that combination of events. Also, numerous cut sets indicate higher vulnerability. Cut sets can also be used to discover single point failures (one independent element of a system which causes an immediate hazard to occur and/or causes the whole system to fail.)
As an example, consider the fault tree shown in Figure 1.
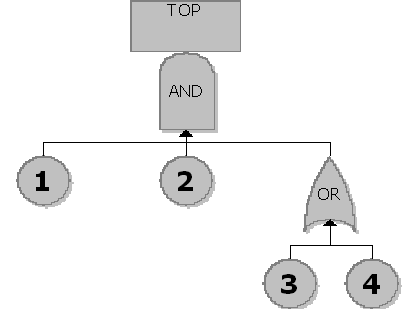
Figure 1:
Minimal cut set example
The system will fail if {1, 2, 3 and 4 fail} or {1, 2 and 3 fail} or {1, 2 and 4 fail}. All of these are cut sets. However, the one including all components is not a minimal cut set because, if 3 or 4 is removed, the remaining events are also a cut set. Therefore, the minimal cut sets for this configuration are {1, 2 ,3} or {1, 2, 4}. This may be more evident by examining the RBD equivalent of Figure 2, as shown in Figure 2.
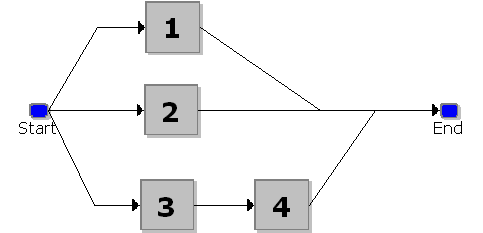
Figure 2: RBD of the fault tree shown in
Figure 1
Using the Show Cut Sets command available in the Tools menu, the minimal cut sets can be obtained as follows.
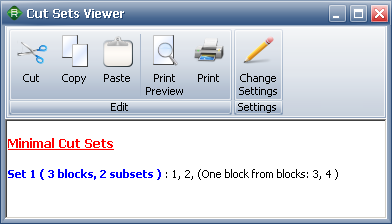
Figure 3: Minimal cut sets for diagrams
shown in Figure 1 and Figure 2
Another Application of Cut Sets: Converting a Complex Diagram/System To a Fault Tree
Consider the following RBD that represents a telecommunication network.
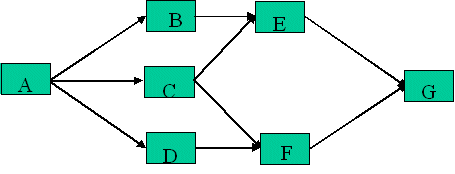
Figure 4: Complex telecommunication network
system
The construction of the fault tree can be very tedious. A straightforward approach is available using minimal cut sets.
First, the RBD is constructed (note that once an RBD is constructed, the analysis can be performed based on the RBD. For the sake of this example, we assume that the analyst prefers using fault trees). Then, the minimal cut sets are obtained.
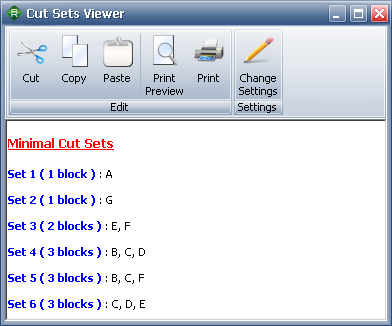
Figure 5: Minimal cut sets for diagrams
shown in Figure 4
All the minimal cut sets are then connected in a fault tree using the OR gate. Within each set that contains multiple blocks, the multiple blocks are connected with an AND gate.
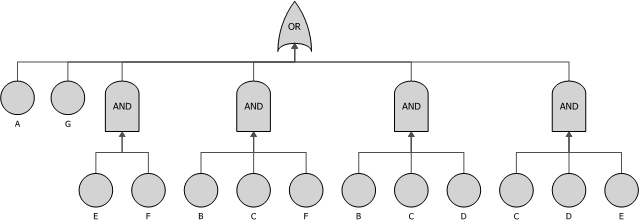
Figure 6: Intermediate fault tree
equivalent to the diagram shown in Figure 4
In the above figure, the B, C, D, E and F events are placed multiple times in the fault tree. If the fault tree is left in this state, these events will be accounted for multiple times as if all the events, with the same name, occur independently and and at different times (having the same name does not make the events dependent). This is a common mistake when using minimal cut sets. In order to resolve this issue and indicate that the events, with the similar names, are actually identical events that can only occur once and can effect different parts of the fault tree, mirror blocks are used. Mirror blocks can be used to mirror the same blocks that appear in different places in the fault tree and indicate that they are in fact the same event.
The final fault tree is shown next.
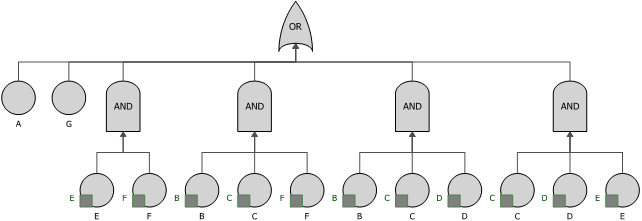
Figure 7: Fault tree equivalent to the
diagram shown in Figure 4
References
1. Kececioglu, D., Reliability Engineering Handbook, Volume 2, Prentice Hall, Inc., New Jersey, 1991.