When is it Appropriate to Use/Trust the Distribution Wizard?
A prior HotWire article described how to use the Distribution Wizard in Weibull++. It explained how the Distribution Wizard ranks the various selected models to determine which possible model fits the data the best. It also discussed how each model is analyzed using three methodologies, the Kolmogorov – Smirnov (K-S) Test, a normalized correlation coefficient and the likelihood value associated with the best fit parameters from a maximum likelihood analysis. This is followed by each model being ranked based on each method and a final model ranking being generated from the combination of the individual rankings.
In this article, we review several different data sets, analyze them using the Distribution Wizard and then discuss whether the model suggested by the Distribution Wizard is appropriate to use.
Now, not only is it important to know how the Distribution Wizard works, it is also good to know when it is appropriate to use it, and when to trust the highest ranked model once a ranking has been made. This is not to say that we should not use the Distribution Wizard at all, because it can often be very useful in providing the statistically best fitting model. However, we have to realize that there are times when none of the statistical models within the Distribution Wizard are good fits to our data. In this case, we end up being given the best of the bad, which can still be a poor overall fit. Or in other cases, where multiple models might end up being good fits for the data available, statistics alone is not enough and and knowing the failure mechanism can be invaluable for choosing the most appropriate model. It is important to note that although the Distribution Wizard will rank data sets with as few as two or three failures (depending on the number of parameters in a particular distribution), it is recommended that the Distribution Wizard be used to choose a model only for larger data sets.
For the following examples, we will restrict the Distribution Wizard by removing the 2-parameter exponential, 3-parameter Weibull and the generalized gamma models. (The first two because they include a shift parameter and the third because it is a complex model that can easily mimic many of the other models and therefore often appears to be the best fit.) Note that using the probability plot to verify that your model is a good fit or a bad fit is appropriate for cases where you have all, or mostly, failure data and the rank regression (RRX or RRY) methodology was used to fit the distribution to the data. Using the probability plot to verify a good fit is not appropriate when using MLE, especially in the cases where there are few failures and large number of suspensions.
CASE I
In this case, we do not have any knowledge on the failure mechanism(s); we just have the following failure data:
| Failure Time (hrs) | ||||
| 264 | 720.7 | 1339.3 | 2008.2 | 3177.5 |
| 353.5 | 850.7 | 1559.1 | 2060.9 | 3540.5 |
| 585.2 | 973.7 | 1738.4 | 2444.5 | 3607.4 |
| 590.9 | 1110.7 | 1827.8 | 2457.9 | 5067.5 |
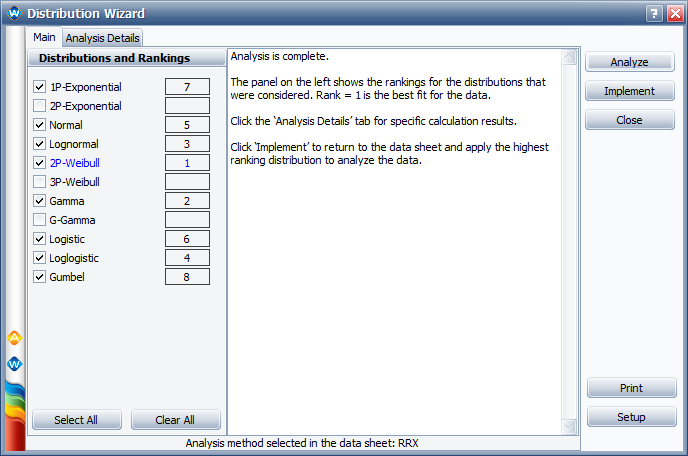
Running the Distribution Wizard on this data set, we see that the 2-parameter Weibull distribution is the highest ranked fit.
Looking at the probability plot, we can see that the model does indeed fit the data well.
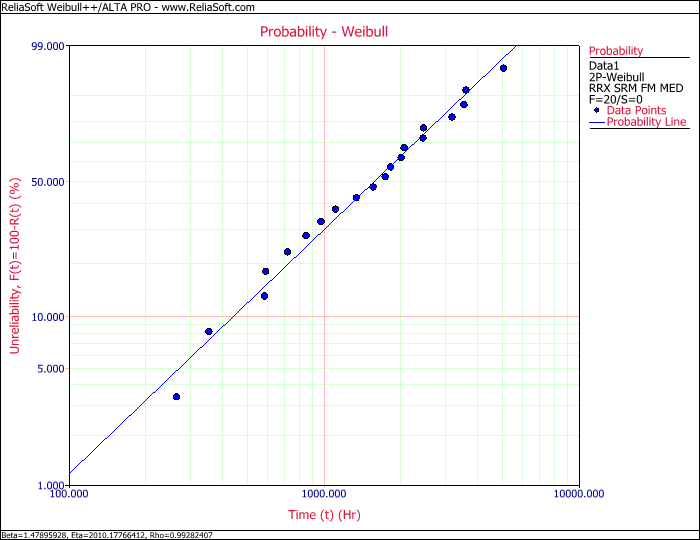
Therefore we can conclude that, to the best of our knowledge and statistical abilities, the data does indeed appear to follow a 2-parameter Weibull distribution.
CASE II
In this case, the suspected failure mechanism is fatigue and the following failure data is available:
| Failure Time (hrs) | ||||
| 160.7 | 230.3 | 380 | 509.3 | 773.4 |
| 199.1 | 275.8 | 421.2 | 520 | 868.3 |
| 206.7 | 313 | 455.7 | 601.2 | 886.6 |
| 213.3 | 337.9 | 473.2 | 604.1 | 1354.4 |
Running the Distribution Wizard on this data set, we see that the gamma distribution is the highest ranked fit, but we also see that the lognormal distribution was ranked second highest.
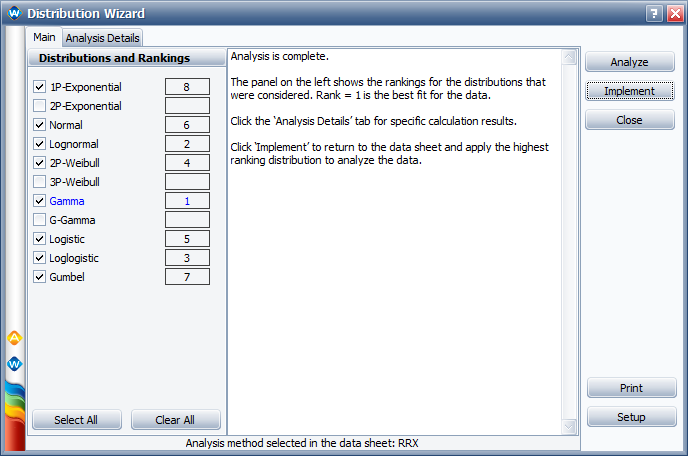
Even though the Distribution Wizard ranked the gamma distribution the highest, we suspect that the failure mechanism is fatigue, and the lognormal distribution is usually used for fatigue analysis. Therefore, we carefully review the probability plots for both the gamma and the lognormal distributions.
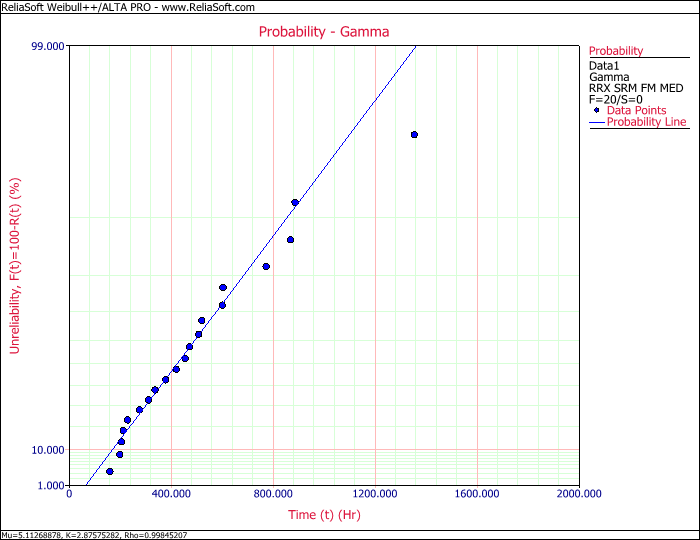
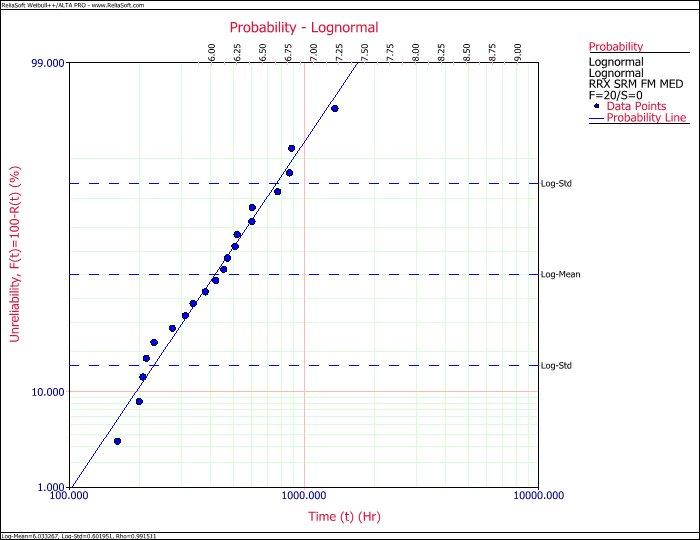
We see that the lognormal distribution also appears to be a very good fit for our data, and since we suspect that the failure mechanism is fatigue, we will choose to use the lognormal distribution.
CASE III
In this case, once again we do not have any knowledge about the failure mechanism(s); we just have the failure data:
| Failure Time (hrs) | ||||
| 3.8 | 23.5 | 589.1 | 1598.3 | 3190.6 |
| 9.7 | 50.2 | 873.7 | 1687.5 | 3550.8 |
| 16.1 | 243.8 | 1146.4 | 2293.2 | 3613.3 |
| 20.5 | 354.6 | 1293 | 2312.5 | 4856.8 |
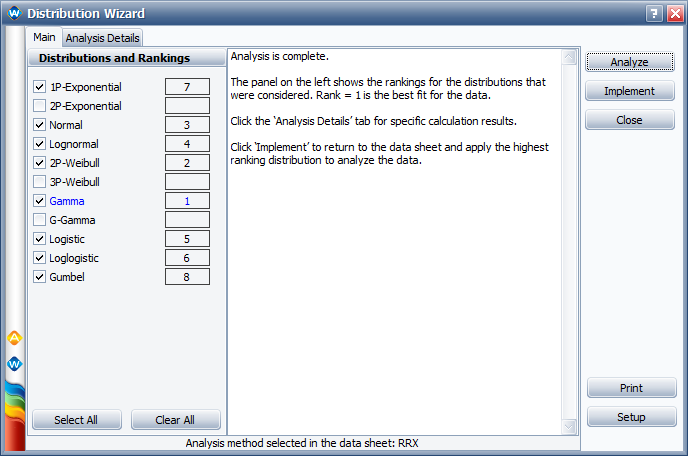
Running the Distribution Wizard shows us that once again, the gamma distribution appears to be the best fit.
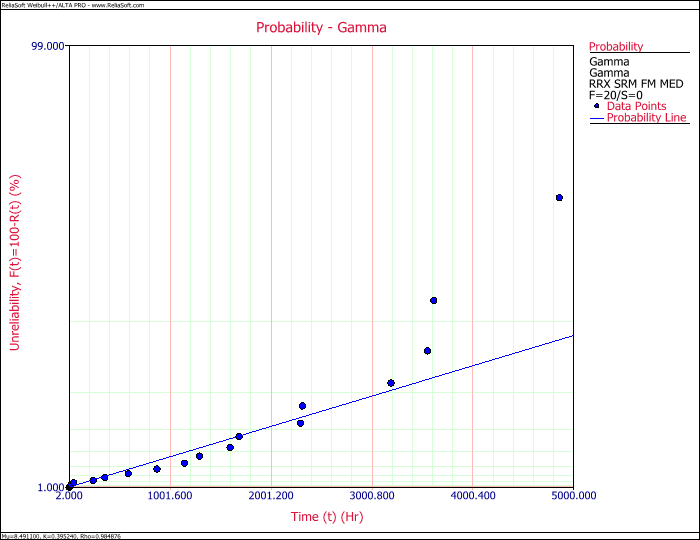
However, looking at the probability plot shows that the gamma distribution is actually not a very good fit for our data.
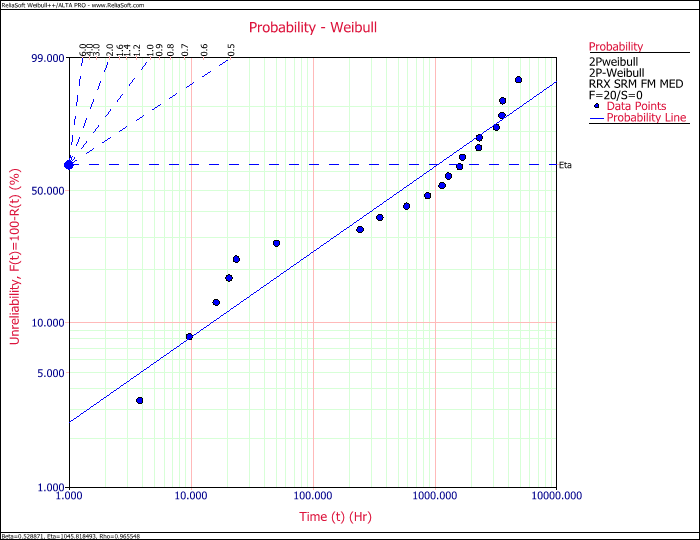
Since we do not like the gamma distribution fit, we decide to take a look at the second ranked distribution, which is the 2-parameter Weibull. That also turns out to be a poor fit. In fact, we begin to suspect that this data set might contain multiple failure modes, as there appears to be curvature and slope changes (commonly referred to as an S-shape) in our probability plots (which is very evident in the 2-parameter Weibull plot).
In this case, we do not have a root cause analysis (and therefore we have no knowledge of which data points might belong to which failure modes). Because we suspect that there are multiple failure modes, we decide to try a 3-subpopulation mixed Weibull model. This model does appear to fit the data well.
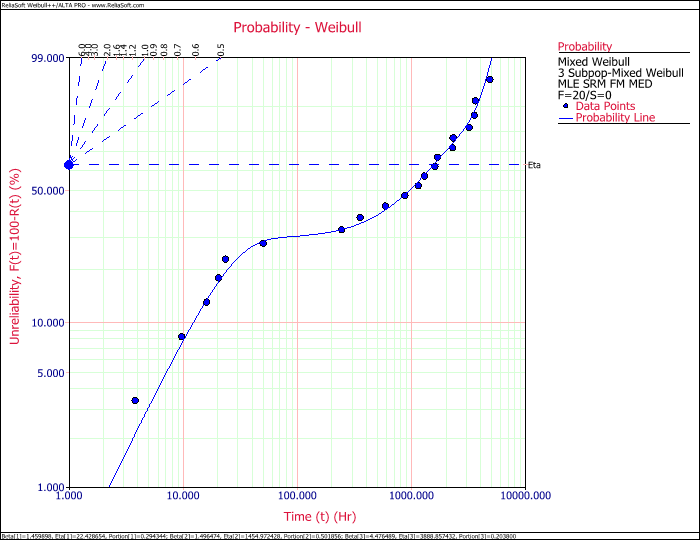
Based on the fit, we conclude that there is more than one failure mode present within the failure data. In this case, because we had more than one failure mode, all distributions ranked by the Distribution Wizard were poor fits, as it only analyzes distributions that are used for one failure mode at a time.
Conclusions
While the Distribution Wizard can be a very powerful tool to help us in determining which distribution we should use to represent our data, it is very important to understand that it should not be used blindly. We should always verify that the model chosen does indeed represent our data well. When we have knowledge on the failure mechanism(s), we should also use our engineering judgment when determining our distribution of choice.