Beyond Event Trees – Using RENO for Static and Dynamic Event Graphs
Traditional event tree analysis (ETA) is a technique for modeling and evaluating all the possible outcomes that could result from a single initiating event. The event graph, on the other hand, is a technique for examining the relationships between different events and outcomes, without the limitations of traditional event trees. In this article, we will explore how to use RENO to create and analyze event graphs.
Simple Traditional Event Tree
Traditional event tree analysis is used to identify, model and evaluate the outcomes (responses) from a sequence of events that follow a single initiating event. A traditional event tree starts with an initiating event, and then the consequences of the event progress in a binary (success/failure) manner. Each event creates a path in which a series of successes or failures will occur, and the overall probability of occurrence for the final event (outcome or response) of that path can be calculated. The probabilities for intermediate events are obtained from reliability analysis methods (e.g., reliability block diagrams, fault trees, etc.).
In RENO, you can use binary nodes to build traditional event trees. A binary node has one incoming path and two outputs: true and false. The output of the true path is the incoming value multiplied by the probability (P), while the output of the false path is the incoming value multiplied by (1-P).
Example
Consider a simple ETA of a fire event and its outcomes/consequences. In this example, once a fire starts (PF=1%) it can be detected by a fire detection system (PD=90%). If detected, the fire alarm goes off (PA=70%) and the sprinkler system puts out the fire (PS=80%). If the fire detection system does not work, then none of the events that follow can be initiated, leading to an outcome such as "Death/Injury, Extensive Damage." A traditional approach (using RENO and binary nodes) would result in an event tree like the one shown next.
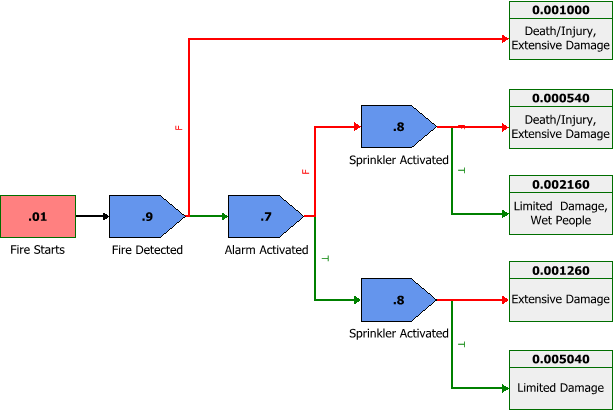
Note that the "Death/Injury, Extensive Damage" outcome appears twice. This is because there are two paths in the event tree that lead to the same outcome.
The following picture shows an alternative, equivalent diagram for the scenario.
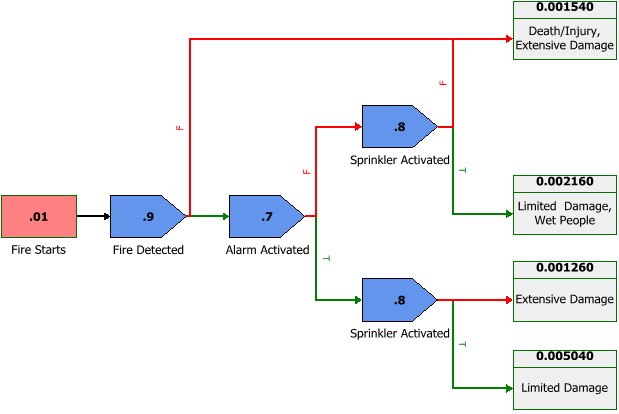
In this rendering, we have moved away from the traditional event tree structure and started looking at the event process as a graph rather than a tree. While this is a trivial implementation, it shows how the concept of event graphs removes some of the constraints imposed by the event tree structure.
Adding Complexity: Event Graphs (or Influence Diagrams)
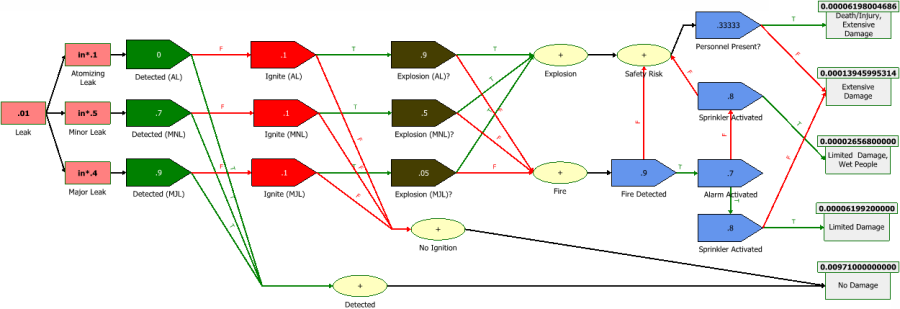
Let’s modify the previous example and add some complexity to it. Assume that the fire event is related to a fuel system that is susceptible to leaks (1% probability) and leaks can lead to a fire. Furthermore, assume that there are different types of leaks, each with a specified probability of occurrence and different subsequent events. Specifically:
- Atomizing Leak (10%)
- An atomizing leak is undetectable.
- It is a risk issue if it ignites, and there is a 10% chance of ignition.
- If ignited, there is a 90% chance of an explosion and a 10% chance of a fire.
- Minor Leak (50%)
- A minor leak is detectable, with a 70% chance of detection.
- It is a risk issue if it ignites, and there is a 10% chance of ignition.
- If ignited, there is a 50% chance of an explosion and a 50% chance of a fire.
- Major Leak (40%)
- A major leak is detectable, with a 90% chance of detection.
- It is a risk issue if it ignites, and there is a 10% chance of ignition.
- If ignited, there is a 5% chance of an explosion and a 95% chance of a fire.
With regards to risk (death/injury) and damages, assume that:
- At any time, there is a 33% chance that personnel will be in the compartment.
- If personnel are in the compartment:
- If a fire occurs, assume the prior event tree and consequences.
- If an explosion occurs, assume there is 100% chance of death/injury.
Again, we can easily solve this problem by moving away from the traditional event tree structure and into an event graph (or influence diagram). The graph for this example is illustrated below.
Dynamic Event Trees and Graphs
The prior examples illustrated simple applications using static probabilities for each event. In RENO, however, there are no constraints on the way event probabilities can be defined. They can, for example, be linked to different time-dependent distributions or linked to other complex analyses in any other Synthesis application including Weibull++ and ALTA analyses, BlockSim diagrams, fault trees, etc.
Example
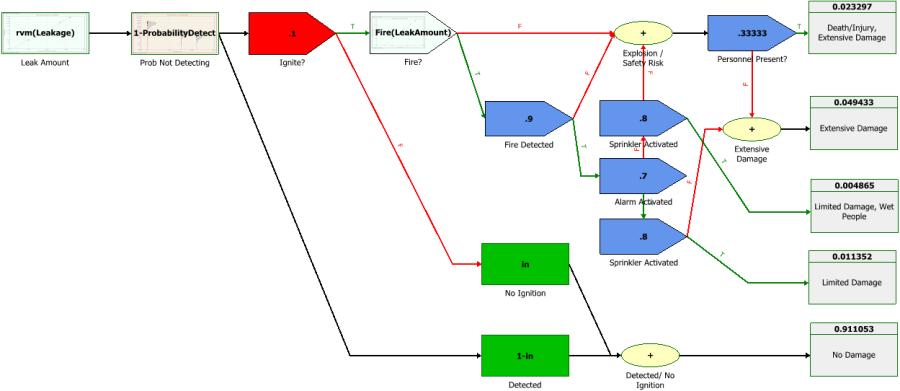
As an example, reconsider the prior example with the following modifications. Assume that the leak rate, measured in grams per second, is now a random function following a Weibull distribution with β=1.13 and η=57.62 g/sec.
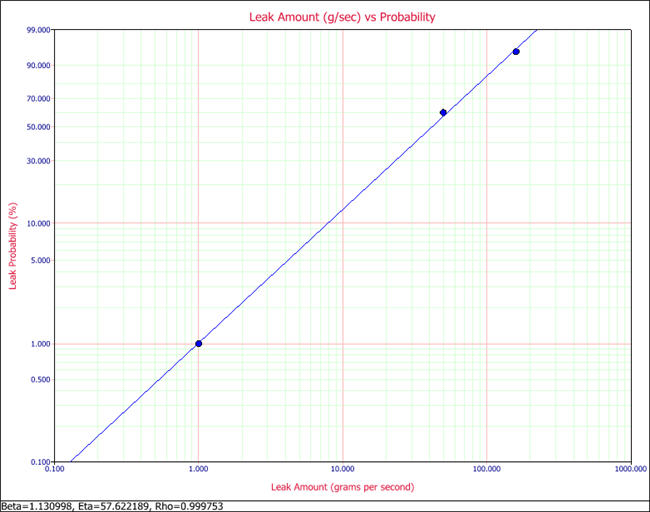
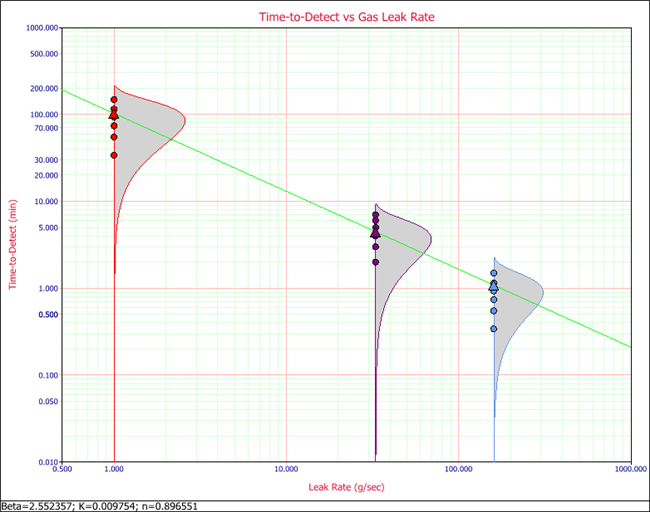
Furthermore, assume that from test data analyzed using ALTA, it was determined that the probability to detect a leak is a function of the total amount leaked (leak rate and time) and it is governed by the following IPL/Weibull model:

where β=2.55, k=0.00975 (min) and n=0.8965.
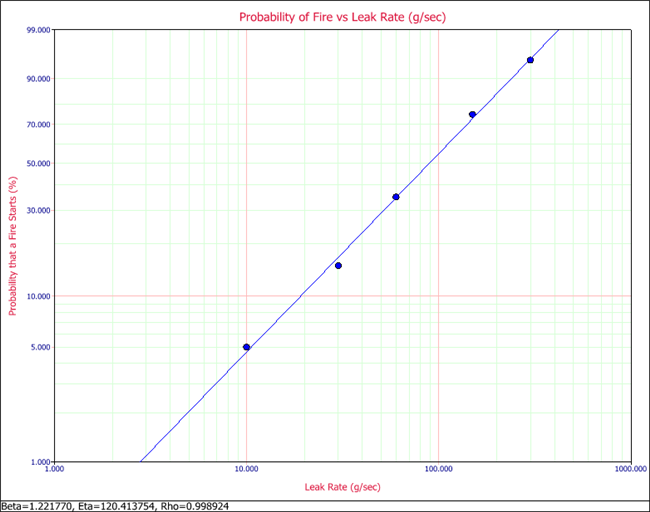
Lastly, assume that the probability of a fire (instead of an explosion) is also a function of the leak rate given by the following Weibull model: β=1.22 and η=120.41 g/sec.
Assume all other events to be fixed probabilities, as in the earlier example.
The following picture shows the event graph that incorporates the modifications that were described. For example, the "Leak Amount" block shows the function rvm(Leakage), where "Leakage" is the Weibull model of the leak rate and "rvm" is a RENO internal function that returns a random value based on the model.
Combining Event Trees and Graphs with Design of Experiments (DOE)
Consider the first event tree example. Assume that the response of interest is "Death/Injury, Extensive Damage" and the factors leading to this are "Fire Detected," "Alarm Activated" and "Sprinkler Activated."
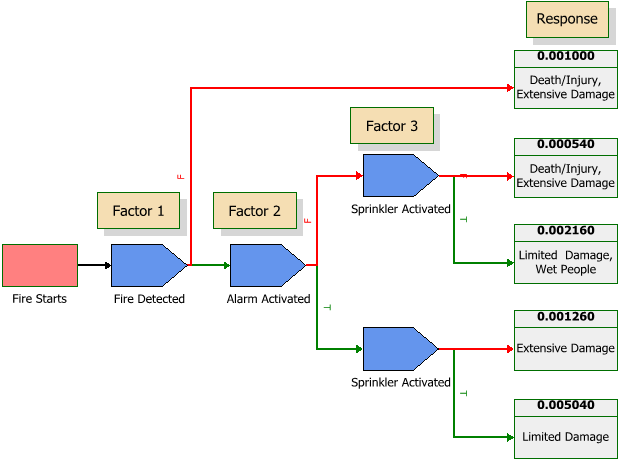
You can create a DOE by varying the factors and computing a different response value for each combination of factors. Within the Synthesis Platform this can be set up as an automated process between RENO and DOE++ by linking the two applications, with DOE++ acting as the experiment designer and analysis tool, and RENO as the response provider.
Expanding Your Analyses with RENO
As briefly illustrated in this article, the Synthesis version of RENO provides an extremely powerful platform for advanced event, risk and reliability analyses. While this example was focused on the concept of event graphs for risk assessment, RENO’s flexibility makes it suitable for any type of complex static or dynamic analysis.
You can download a copy of RENO (or activate a DEMO version if you already have Synthesis installed) to explore its capabilities. More RENO examples are available in the example database installed with the software. To access this database file, choose File > Help, click Open Examples Folder, then browse for the file called "RENOxx_Examples.rsgzxx"in the RENO sub-folder.
