Measurement Systems Analysis in DOE++
With the release of Version 9, DOE++ now provides a set of tools for measurement systems analysis. Among these tools, the linearity and bias folio is used to study the accuracy of a measuring device, and the gage R&R folio is used to study its precision (i.e., the variation in measurements that can be expected when the same part is measured repeatedly using the same measuring device). In this article, we will demonstrate how to use DOE++ to examine precision.
Within a measurement system, there are three basic sources of variation: variation due to the part, variation due to the measuring device (or gage) and variation due to the operator. The interaction between the operator and part can also produce variation (e.g., some operators may be able to see small parts better than others). When a gage repeatability and reproducibility (R&R) study is performed, the following two sources of variation are examined. Together they constitute the precision of the measurement system.
- Repeatability: Variation due to the measuring device. It is the variation observed when the same operator measures the same part repeatedly with the same device.
- Reproducibility: Variation due to the operator and the interaction between the operator and part. It is the variation of the bias observed when different operators measure the same parts using the same device.
Why do we need to evaluate the precision of a measurement system? If a system is not both accurate and precise, any conclusions based on data obtained from it are likely to be unreliable. For example, if the measurements collected during a degradation analysis are not accurate and precise, then the predicted reliability based on this data will likely be incorrect.
The gage R&R folio in DOE++ can be used to quantify the variations explained above, which can provide some guidance if the measurement system needs to be improved. For example, if the variation due to the operator is too high, then better training should be conducted. And if the operators are very consistent but the variation due to the gage is too high, then the gage should be calibrated and tuned up, or better gages should be purchased.
Example
The following tables show a total of 80 measurements obtained by two operators. Each operator measured the outer diameter of 20 bearings (identified as Part# 1, 2, and so on) in millimeters, and each bearing was measured twice by each operator (i.e., two trials were used).

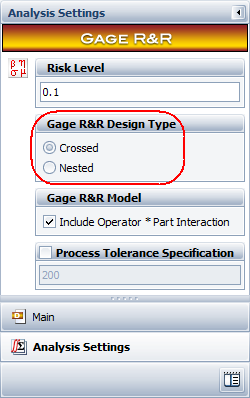
The gage R&R folio lets you choose between a crossed and nested experiment design. For this analysis, a crossed experiment is used because each part was measured by multiple operators. (Nested designs are used when the each part is measured by only one operator, such as in destructive testing.)
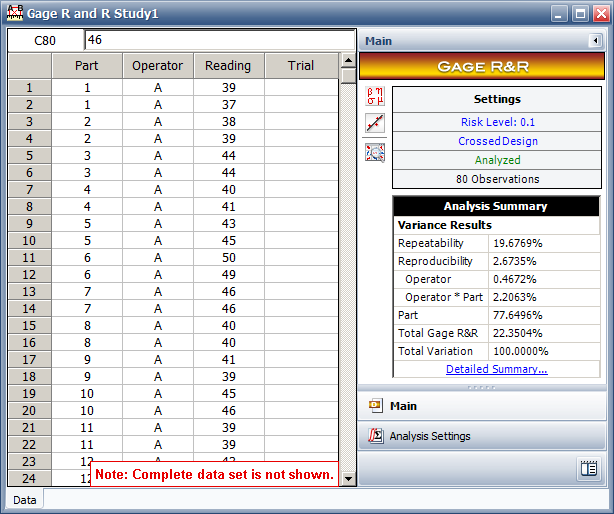
After the data set is entered and calculated, the analysis summary on the control panel shows a breakdown of the sources of variation. At this point, you can see that repeatability (19.6769% of variation) is more of an issue than reproducibility (2.6735%).
The detailed summary lets you view two different tables that provide more information about the analysis results. The ANOVA table is used to quantify the variation from each source. A small p value meansthe corresponding source's variation is relatively large compared to the variation due to noise (as is the case with the part variation). Here the noise is the "repeatability."

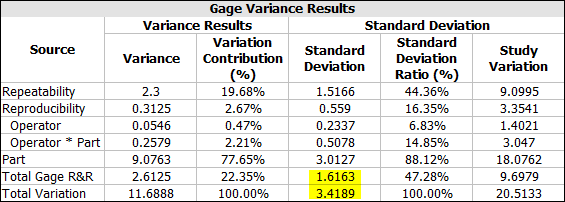
The Gage Variance Results table shows the variance, standard deviation and the contribution of each source of variance. (For details about each column in this table, please see Gage Repeatability and Reproducibility (R&R) Study.) A rule of thumb commonly used to determine whether a measurement system is adequate is to see if the precision-to-total ratio is less than 10%. To calculate this ratio, divide the standard deviation of the Total Gage R&R by the standard deviation of the Total Variation (highlighted below). In this case, 1.6163/3.4189 = 0.473, or 47.3%. Since the ratio is much higher than 10%, the measurement system needs to be examined.
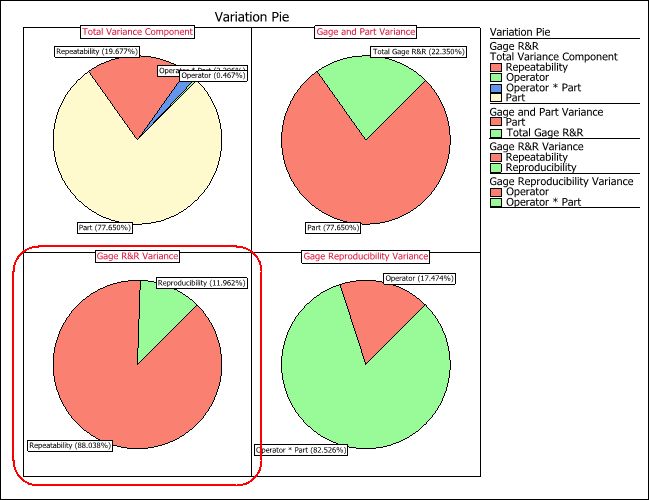
The percentage of the above variation from each source can be visualized by opening the Plot sheet and selecting the Variation Pie plot type. This report uses pie charts to display different breakdowns of the sources of variation. The pie chart on the lower left shows that that repeatability is by far the greatest contributor compared to reproducibility, which further indicates that there is a problem with the measuring device.
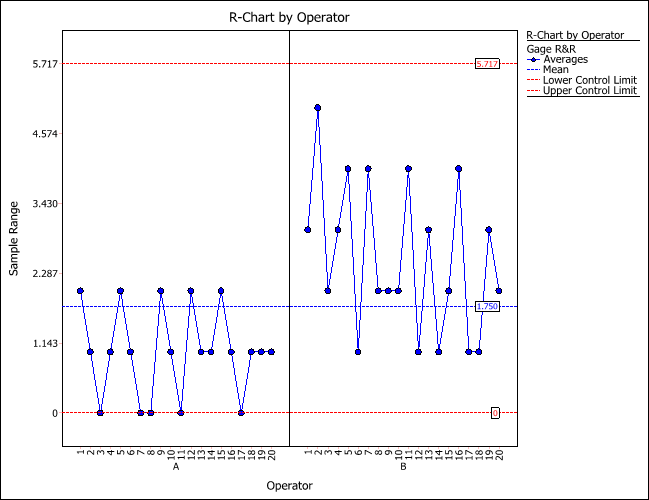
DOE++ also provides several other plots that can help you determine the sources of variance. The R-chart shows that while both operators' measurements are within control (which suggests that reproducibility is not an issue), operator B shows substantially more variability. In other words, operator B is having more difficulty making consistent measurements than operator A, and therefore may require additional training in how to perform the measurements.
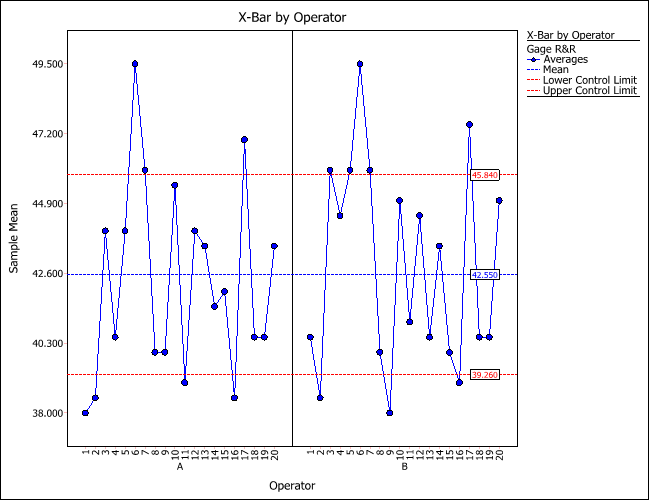
The X-bar chart shows that, for both operators, the mean values of different parts change dramatically. This explains why the part variation is relatively high (77.65%), as shown in the previous Gage Variance Results table. In addition, most of the points are within the control limits, which confirms that repeatability is a problem and the measuring device therefore needs to be adjusted or replaced. The control limits are based on the repeatability error, rather than the part-to-part variation. If none of the part averages are outside the limits, the part-to-part variation then is hidden within the repeatability or gage variation, and the repeatability variation dominates the process variation.
The X-bar chart also shows that the grand averages of Operator B and Operator A are very close. This provides additional evidence that reproducibility is not an issue.
Conclusion
In this article, a gage R&R study was performed with DOE++ to examine the precision of a measuring system. The analysis results show that the measuring device needs to be adjusted or replaced. In addition, operator B may need further training in order to make more consistent measurements.
For more discussion on measurement system analysis (MSA), including gage agreement, linearity and bias, and gage R&R studies, please refer to https://help.reliasoft.com/reference/experiment_design_and_analysis/doe/measurement_system_analysis.html.