Using Central Composite Design for Process Optimization
[Editor's Note: This article has been updated since its original publication to reflect a more recent version of the software interface.]
Design of Experiments (DOE) is a set of techniques that revolve around the study of the influence of different variables on the outcome of a controlled experiment. Generally, it involves identifying the independent variables or factors that affect a product or process, and then studying their effects on a dependent variable or response. In this article, we will give an example on how to use Central Composite Designs in a DOE design folio in Weibull++ to determine the settings of factors that would result in the optimum value of the response.
Example
An experiment is conducted to determine the optimal factors of a flux cored arc welding process for steel. Four factors will affect the tensile strength of welded joints: current, voltage, stick out and angle. The goal is to determine the settings that will maximize the tensile strength. The following table shows the initial settings of the welding process:
| Independent Variable | -1 | 0 | 1 |
| Current (Amp) | 250 | 275 | 300 |
| Voltage (Volt) | 25 | 27.5 | 30 |
| Stick Out (Millimeter) | 45 | 50 | 55 |
| Angle (Degree) | 45 | 60 | 75 |
Table 1: Coded Levels for Each Variable
Model
A second order polynomial equation is used to express the tensile as a function of independent variables:

where y represents the tensile strength (unit:kgf).
The coefficients of the response surface equation can be determined by using a DOE design folio.
Experiment Design
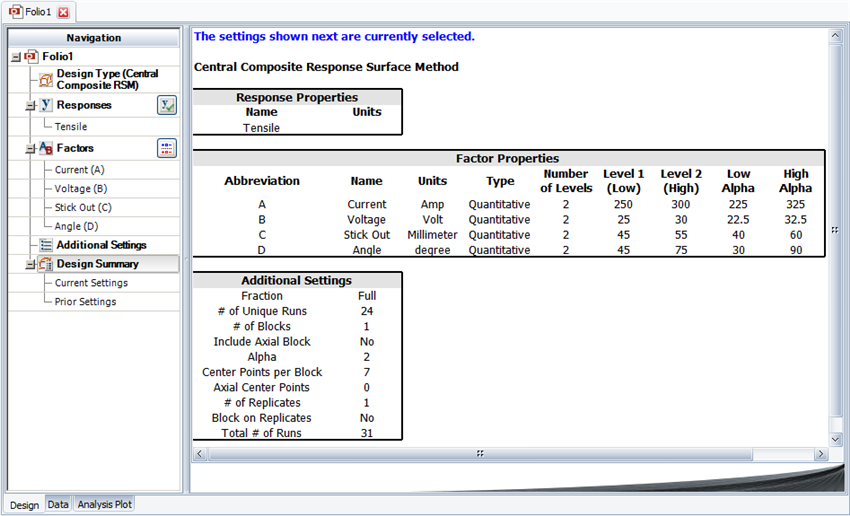
We will use a Central Composite design. The following picture shows the design settings in the DOE design folio.
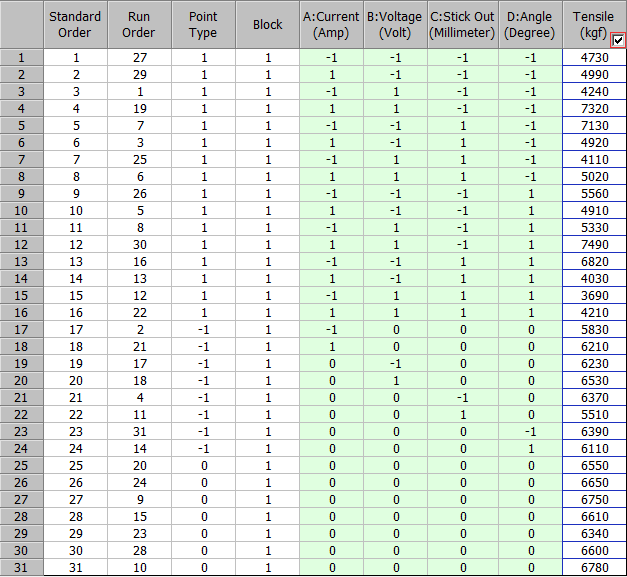
The following data sheet shows the resulting design table (using coded values) and the corresponding effect of the factors on the tensile strength. The design uses 31 different combinations chosen in random order. The effect of each combination is recorded in the "Tensile" column.
Results and Discussion
The statistical analysis indicates that the model is adequate, possessing no significant lack of fit and with a very satisfactory value for the R-Squared (0.985). The closer the value to unity, the better the empirical model fits the actual data.
The effects of current, voltage, stick out and angle on the tensile weldment are also shown in the Regression Information table and in the following 3D plots.
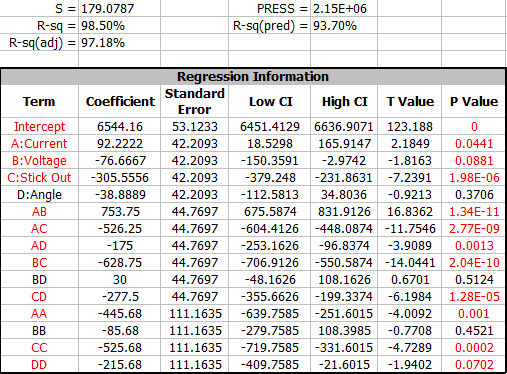
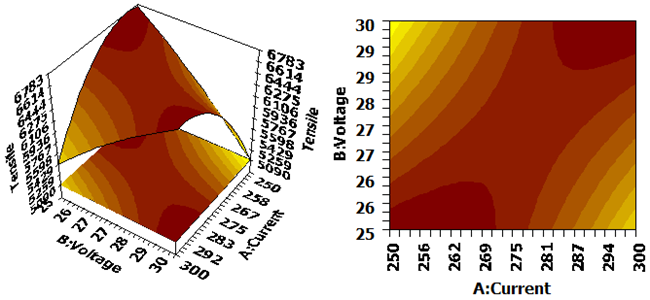
Figure 1: RSM and Contour Plots of Current and Voltage.
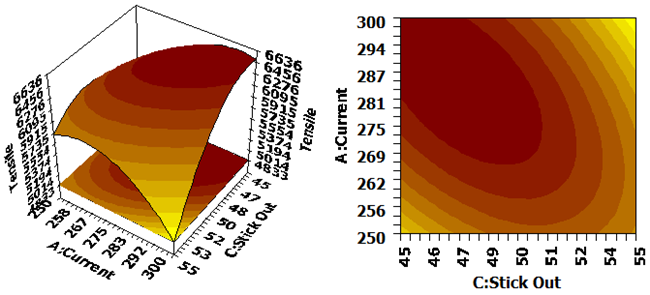
Figure 2: RSM and Contour Plots of Current and Stick Out
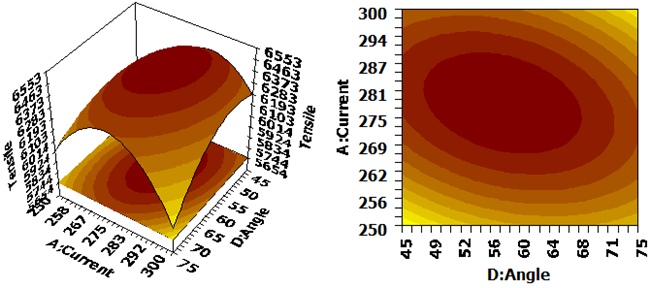
Figure 3: RSM and Contour Plots of Current and Angle
Optimization
Click the Optimization icon on the control panel.

Use the following settings for the response.
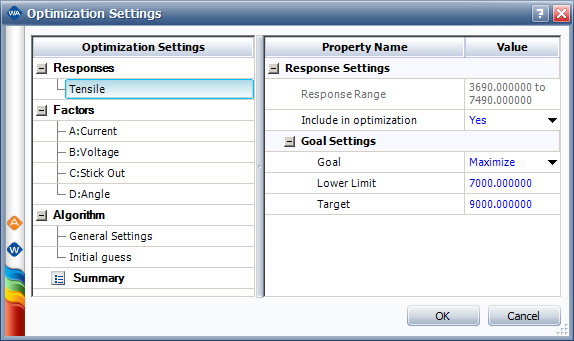
Click OK to close the window and plot the optimal solution, as shown next.
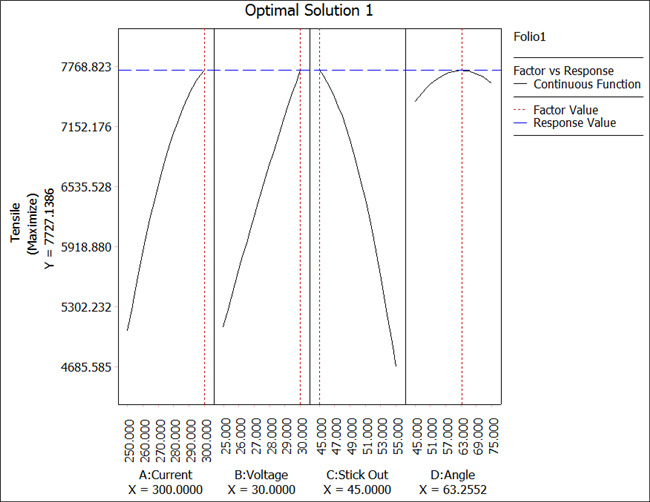
Therefore, the optimal settings are current = 300 ampere, voltage = 30 volts, stick out = 45 millimeter and angle = 63.255 degree. Although the optimal setting for angle is 63.255, it is very difficult to set it to that exact value. The process engineers decide to use 60 degrees as the final setting.
To estimate the tensile strength of welds for these settings, use the Prediction tool. Return to the data sheet and click the Prediction icon on the control panel.

Enter the values for the optimal settings, as shown next, and click Calculate. The tensile strength is estimated to be 7,716.9811 kgf.

References
Sathavornvichit, N., Bookkamana, P., and Plubin, B. "Central Composite Design in Optimization of the Factors of Automatic Flux Cored Arc Welding for Steel ST37" in Proceedings IMT-GT Regional Conference on Mathematics, Statistics and Applications, Penang, Malaysia 2006.
Myer, R. and Montgomery, D.C., Response Surface Methodology, New York: John Wiley, 2002.
Box, G.E.P., Hunter, W.G., Hunter, J.S., Statistics for Experimenters, New York: John Wiley, 1978.