Modeling Nonlinear Systems in Reliability Phase Simulation
A major feature in BlockSim is the ability to include success and failure paths for phase diagrams, which makes it easy to see what will happen upon the success or failure for each phase. Previously, there was only one path from each phase in a reliability phase simulation. Thus, the failure outcome for each phase was defined via a drop-down list and we could only model a linear system. The new success and failure paths enable us to create more complex nonlinear phase diagrams, in which success and failure may lead to entirely different sets of phases. In addition, they offer an additional possible failure outcome -- continuing of the simulation on a different path. For a failure path, the system goes to somewhere immediately when the system failure occurs. For a success path, if there is no system failure during this phase, then the system goes to somewhere else by the end of the current phase. In this article, we will illustrate the application of the success and failure paths in phase simulation by following an example of an aircraft that may be forced into an emergency landing if the aircraft fails.
Example: Aircraft Phases with Forced Landing
Consider simulating a flight mission for a four-engine aircraft. The configuration of the aircraft changes at different times:
- During the taxiing phase, the navigation system, one out of the four engines and all three landing gears must work.
- During the take-off phase, the navigation system, all four engines and all three landing gears must work.
- During the cruising phase, the navigation system and three of the four engines must work.
- During the landing phase, the navigation system, two of the four engines and all three landing gears must work.
After finishing a journey with these four phases, the aircraft goes into a maintenance phase. However, in addition to the four operational phases discussed, there is a special operational phase called the forced landing phase. This phase is used for modeling the case when there is a failure during the take-off phase, the cruising phase or the landing phase, which forces the aircraft to make an emergency landing. If the forced landing succeeds, the aircraft goes into the maintenance phase. However, if the forced landing fails, the aircraft crashes and the simulation ends.
The reliability block diagrams (RBDs) for each phase are shown in Figures 1 to 5 while Figure 6 shows the main phase diagram.
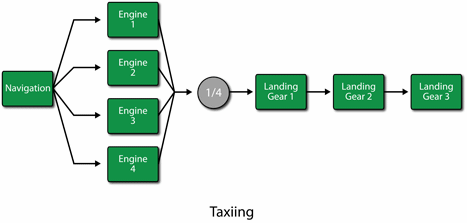
Figure 1: RBD for the
taxiing phase
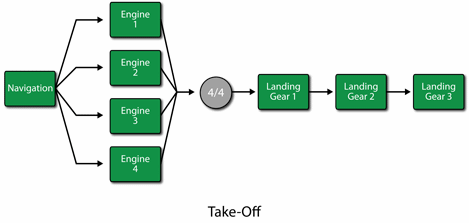
Figure 2: RBD for the
take-off phase
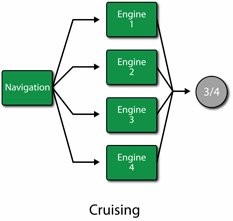
Figure 3: RBD for the
cruising phase
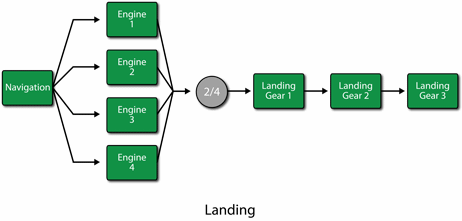
Figure 4: RBD for the
landing phase
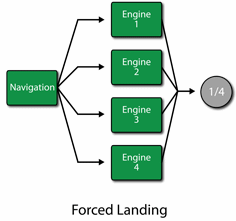
Figure 5: RBD for the
forced landing phase
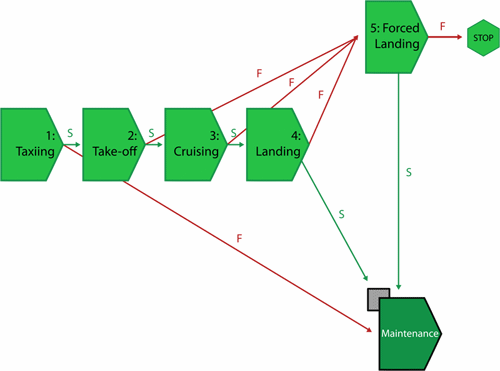
Figure 6: The main phase diagram
From Figure 6, we can see that there is a failure path from the taxiing phase to maintenance phase, which means that if a failure happens in the taxiing phase, then the aircraft will get maintenance immediately. The take-off, cruising and landing phases all have a failure path to the forced landing phase, which means that if a failure happens in these phases, instead of a regular landing, the aircraft experiences a forced landing. In the forced landing phase, there is a failure path linked to a stop node, which means that if the forced landing fails, then the aircraft crashes and the simulation stops.
The reliability of the navigation system follows a Weibull distribution with Beta=1.5 and Eta=30 hours. The reliability of the engines follows a Weibull distribution with Beta =1.5 and Eta=20 hours. The reliability of the landing gears follows a Weibull distribution with Beta=1.5 and Eta=15 hours.
In the maintenance phase, all blocks have a corrective maintenance task with a duration of 3 hours. Corrective maintenance is performed upon item failure. All blocks also are subjected to a preventive maintenance task with duration = 0.5 hours and which is performed when the maintenance phase starts. Both tasks restore the blocks to as good as new.
The phase durations are:
- Taxiing – 0.5 hours
- Take-Off – 1 hour
- Cruising – 5 hours
- Landing – 0.5 hours
- Forced Landing – 1.5 hours
Figure 7 shows the events that occurred during the simulation.
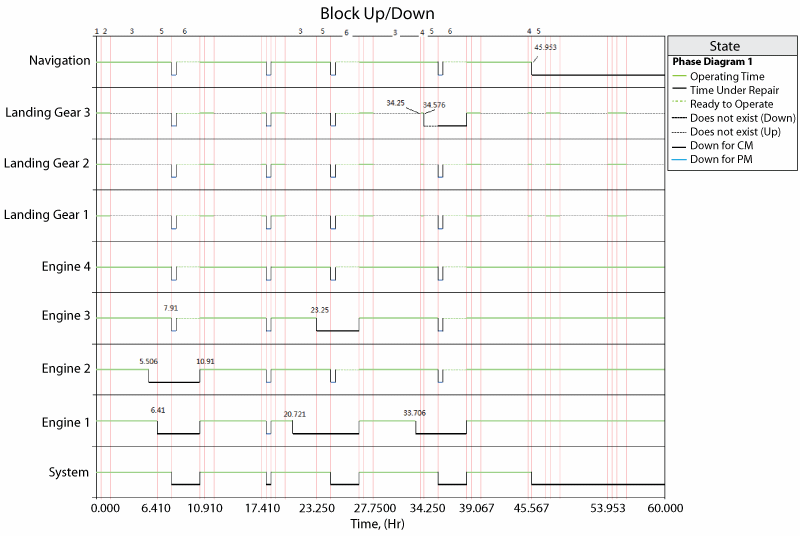
Figure 7: Behavior of the aircraft phase diagram with a forced landing
The plot can be read as follows:
- At time 5.506 hours, in the cruising phase, Engine 2 fails. However, this failure does not bring the system down because only three of the four engines are required during this phase.
- At time 6.41 hours, in the cruising phase, Engine 1 also fails. This failure brings the system down and the system goes into the forced landing phase immediately.
- At time 7.91 hours, the forced landing phase is completed. No failure happened in this phase, which means the forced landing is successful. The system goes into the maintenance phase. All blocks except Engine 1 and Engine 2 get preventive maintenance in the maintenance phase.
- At time 10.91 hours, Engine 1 and Engine 2 are done with their corrective maintenance and the system goes back to the taxiing phase.
- At time 20.721 hours, in the cruising phase, Engine 1 fails again. As before, this failure does not bring the system down.
- At time 23.25 hours, in the cruising phase, Engine 3 fails and this failure brings the system down. The system goes into the forced landing phase, which succeeds. After the forced landing phase, the system goes into the maintenance phase.
- At time 33.706 hours, in the cruising phase, Engine 1 fails again. Again, this failure does not bring the system down.
- At time 34.25 hours, the system goes into the landing phase.
- At time 34.576 hours, in the landing phase, landing gear 3 fails and this failure brings the system down. The system goes into the forced landing phase immediately.
- At time 45.953 hours, in the landing phase, the navigation system fails. This failure brings the system down and the system goes into the forced landing phase immediately. In the forced landing phase, the failure of the navigation system brings the system down. This means the forced landing fails and the system goes into the Stop node and the simulation stops.
Conclusion
In this article, we first briefly introduced a feature in BlockSim: the success and failure paths of phase simulation. We then illustrated this new feature through a detailed example. From this example, we can see that the success and failure paths make it easier to model the complex nonlinear system in phase simulation.