Taguchi Robust Design for Product Improvement
[Editor's Note: This article has been updated since its original publication to reflect a more recent version of the software interface.]
Taguchi robust design is used to find the appropriate control factor levels in a design or a process to make the system less sensitive to variations in uncontrollable noise factors (i.e., to make the system robust). Ideally, a product's performance should be consistent no matter what the noise values are. In this article, we will use ReliaSoft's DOE++, a software product for Design of Experiments, to illustrate how to use a Taguchi robust design to make a robust product.
Example
An automobile manufacturer wants to improve the quality of the painted surface of its cars. Quality is measured by the gloss reading of the surface. The manufacturer wants the painted surface to have a higher gloss reading (i.e., maximize the response) and to be robust against the environment. Environmental factors, particularly temperature and humidity, are known to affect the painted surface. Thus, a robust design will be used here. For a detailed background on robust design, please see: https://help.reliasoft.com/reference/experiment_design_and_analysis/doe/robust_parameter_design.html
The control factors have been identified to be the flow rate of the paint, the pressure in the paint gun, the viscosity of the paint and the cure temperature.
The factors and levels are as follows:
| Controllable Factors | Name | Low Level | High Level |
| A | Flow Rate | 30 | 50 |
| B | Pressure | 3 | 5 |
| C | Viscosity | 10 | 15 |
| D | Cure Temperature | 120 | 160 |
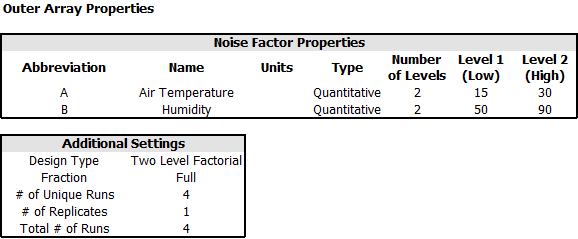
Two noise factors will be taken into account: the air temperature (ambient = room temperature) and humidity (ambient = room humidity).
| Noise Factors | Name | Low Level | High Level |
| A' | Air Temperature | 15 | 30 |
| B' | Humidity | 30 | 90 |
The design matrix for the control factor in a robust design is called the inner array, while the design matrix for the noise factor is called the outer array. For the inner (control) array, a 2 level fractional factorial design with D=ABC is used. For the outer (noise) array, a 2 level full factorial design is applied.
Experiment Design
Add a new robust design folio in DOE++ by choosing Insert > DOE > Add Robust Design. On the Design tab, configure the inner array using these properties.

Then configure the outer array using these properties.
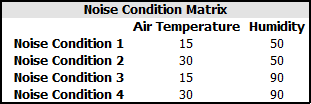
Since we are using a 2 level factorial design for the 2 noise factors, the following 4 noise conditions (i.e., combinations of noise factor settings) will be used in the test.
Click the Build Design icon on the control panel to create the design matrix.
The following data sheet shows the final design table and the corresponding gloss readings. The gloss readings are recorded in the "Noise Condition" columns.
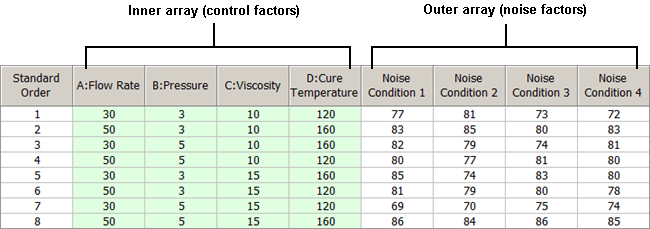
You can conduct the experiment according to the order of runs in the design matrix and record all the response values. (Note that the runs in the data sheet are normally randomly ordered. To see the same order shown above, display the Standard Order column and then sort the sheet by the values in that column.) Once the data set is collected, you can use the robust design analysis method to study the data.
Analysis and Results
The simplest analysis method for robust design is by using the so-called signal noise ratio as the response. For more information on the signal noise ratio, please see: https://help.reliasoft.com/reference/experiment_design_and_analysis/doe/robust_parameter_design.html#SignaltoNoiseRatios.
If the purpose of the experiment is to maximize the output and to decrease the variations caused by noise factors, the larger-the-better ratio can be used. For the ith row of the inner array, it is defined as:
where m is the number of observations of the ith row. For example, for the first row in the data sheet described above, the signal noise ratio is calculated by:
To build a model for the signal noise ratio, follow the steps below.
- On the Analysis Settings page of the control panel, choose Signal Noise Ratio from the Response Settings drop-down list, select the Larger option and select the Individual Terms option.
- Next, select all the effects in the model by choosing Data > Design > Select Terms. In the window that appears, define the settings as shown next. Click OK.
- In the control panel, click Calculate.The results in the analysis summary will include all the effects in the model.
- To identify the significant effects, click Plot and choose Signal Noise Ratio from the Response drop-down list. From the following plot, we can see that effects A and D are significant. So we will use only those two effects in our final model.
- To create the final model, open the Select Terms window again and click Select Significant Effects. This setting clears all other selections except for effects A and D. Click OK.
- In the control panel, click Calculate to recalculate the results. The final results are shown next:


From the Coefficient column, we can obtain the final model for the signal noise ratio:
SNL = 37.9588 + 0.2835A + 0.2845D
From the above equation, we can see that in order to maximize the signal noise ratio, factors A and D should be set to their highest values.
Conclusion
In this article, we used DOE++ to illustrate how to conduct and analyze a Taguchi robust design. First, the significant effects were identified, and then only the significant effects were used to build the final model. Through the analysis, we found that in order to maximize the gloss reading of the painted surface, while making it robust to environmental factors that can't be controlled, factors A and D (flow rate and cure temperature) should be set to their highest levels. Factors C and B (pressure and viscosity) do not have any significant effects on the final gloss reading, so their values can be set according to process requirements or budget constraints.