Determining Significant Effects in 2k Designs with a Single Replicate
[Editor's Note: This article has been updated since its original publication to reflect a more recent version of the software interface.]
Design of Experiments (DOE) is a systematic approach to experimentation that is used to investigate how various inputs (or factors) affect an output (or response) of interest. One of the useful results of the statistical analysis performed in a DOE is whether an investigated factor's effect on the response is significant. In order to do that, replicated runs are required. That means that all the combinations of factor levels (treatments) should be performed more than once. However, in many experiments running replicates of an experiment is not feasible due to a lack of time or resources.
In this article we will present three methodologies that can be applied in the case of 2k designs (where each factor has only two levels) to allow us to test for the significance of an effect without replicated runs. Those methodologies are:
- Normal probability plot of effects
- Pooling higher order interactions
- Using center point replicates
Introduction
In order to test for the significance of a factor or an effect, we use Analysis of Variance (ANOVA) and hypothesis tests. ANOVA is the procedure of splitting the variance of the response measurements into the variance caused by each factor and the variance caused by noise. The variance caused by factor A, for example, is represented by the factor sum of squares (SSA) and the variance caused by noise is represented by the error sum of squares (SSE). Once we have these two variances, we can calculate a test statistic that will be used in performing the hypothesis tests. The test statistic is based on the F distribution and is given by:
![]()
In the case of experiments with a single replicate, we do not have enough observations to calculate the error sum of squares. This is because we are essentially fitting a line to two observations, as shown in Figure 1.
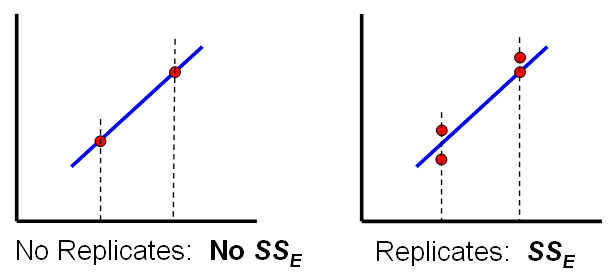
Figure 1: Fitting a
Line to
Observations With and Without Replicates
Since we cannot calculate SSE, we also cannot calculate the test statistic; as a result, we cannot perform the hypothesis test in order to determine the significance of the factor.
Method 1: Normal Probability Plot of Effects
One methodology for identifying significant effects is constructing the normal probability plot of effects. The idea behind this methodology is that all non-significant effects will fall along the straight line representative of the normal distribution, N(0,σ2/2k∙m), where m is the number of replicates. However, in the case of unreplicated 2k designs, σ2 is unknown since SSE cannot be computed. In this case, we use Lenth’s method to estimate the variance of the effects. Under this methodology the estimated variance or the pseudo standard error (PSE) is calculated as 1.5 times the median value of all effects that are less than 2.5∙s0:

where s0 is 1.5 times the median of all effects.
Now given this estimate of variance, the normal probability line is the line N(0,PSE) and all the effects that show large deviations from this line will be significant.
Example 1
A team of engineers in a semiconductor fab that manufactures wafers is setting up a DOE to determine which factors affect the thickness of the wafers. Four factors are suspected to have a significant effect on the thickness, therefore a 24 design is chosen. Table 1 shows the four factors and the chosen levels for each factor.*
Table 1: The Four Factors and their Levels
| Factor | Low | High |
| Temperature | 450 | 500 |
| Time | 5 | 8 |
| Pressure | 10 | 20 |
| Gas Flow | 100 | 150 |
Because of time constraints, only one replicate of the experiment can be run. Figure 2 shows the experiment design and the measured response values as entered in DOE++.

Figure 2: Experiment Design
Since the experiment contains only one replicate, the significance of the effects to the response cannot be determined. Figure 3 shows the results of the analysis with all the individual terms selected to be displayed, where it can be seen that no hypothesis tests were performed (i.e., the F Ratio and P Value columns are not populated).
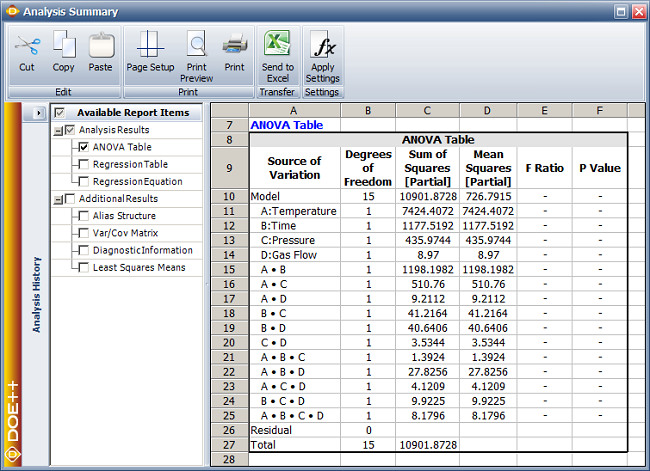
Figure 3: ANOVA Table of
the Experiment Data
However, using Lenth’s method, a normal probability plot can be constructed and the effects that do not fall on the normal probability line can be deemed significant. Figure 4 shows the normal probability plot of the effects.
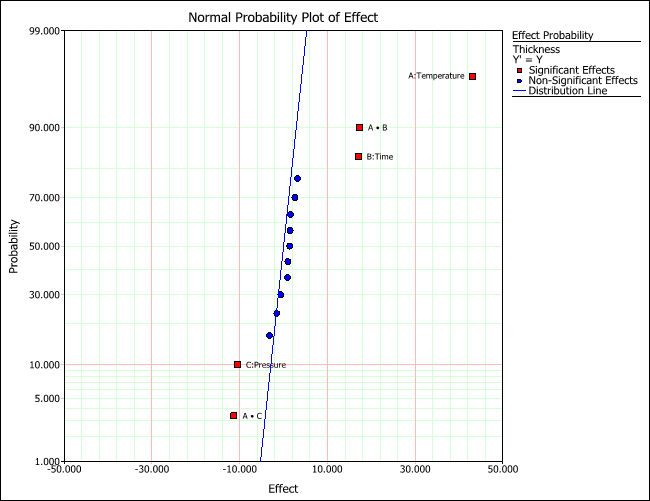
Figure 4: Normal
Probability Plot of Effects
As the plot shows, the three main effects Temperature, Time and Pressure, as well as the interaction effects of Temperature/Pressure and Temperature/Time are determined to be significant.
Method 2: Pooling Higher Order Interactions
In general, higher order interactions can be assumed to be insignificant. Therefore, interactions between three or more factors can be dropped from the model. As a result, the sum of squares of those higher order interactions can be used as the error sum of squares.
Example 2
Consider the same experiment that was described in the previous example. The team of engineers has made the assumption that only effects up to two-way interactions are important and that higher order interactions can be dropped from the model. Figure 5 shows how the higher order interactions can be excluded from the model in DOE++.

Figure 5: Selecting Effects to Be Included in the Model
Once the higher order interactions have been removed, their sum of squares can be used as the error sum of squares and the hypothesis tests can be performed. Figure 6 shows the results of the analysis.
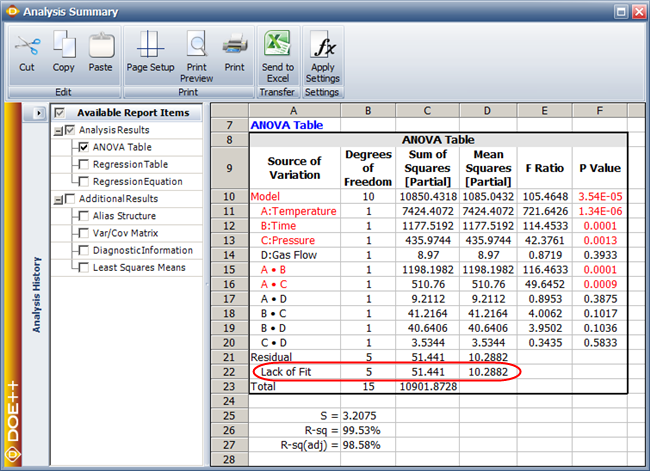
Figure 6: ANOVA Table After
Removing Higher Order Interactions
Removing the higher order interactions from the model introduces a Lack of Fit error, since the model is now not a complete model. The sum of squares of the lack of fit error is now used to perform the hypothesis tests and calculate the p values that determine whether an effect is significant or not. The ANOVA table indicates that the Temperature, Time and Pressure, as well as the interactions between Temperature/Time and Temperature/Pressure are the significant effects (shown in red).
Method 3: Using Center Point Replicates
Another method that can be used to estimate the error sum of squares is to perform a few runs at the center point. The center point is a treatment where all factors are set exactly midway between their two levels. Obviously, in order to have runs at the center point, all factors need to be quantitative since there is no midpoint for a qualitative factor. The replicates at the center point can then provide an estimate of the pure error used to perform the hypothesis tests. The sum of squares of pure error is calculated as:

where:
-
 is the measured response at each center point.
 -
 is the average of all responses at the center point.
Another benefit of using center point replicates is the ability to test for the presence of curvature. If curvature is found to be present, it would indicate that a higher order model might be necessary to accurately represent the response.
Example 3
Consider again the same scenario described in Example 1. The team of engineers has now decided to perform five runs at the center point. The design of the experiment and the measured response values are shown in Figure 7.
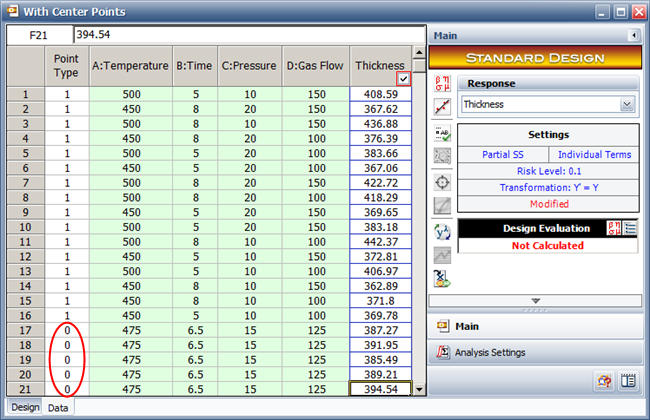
Figure 7: Experiment Design with
Center Points
The center points are indicated with a zero in the Point Type column and each factor is set at the midpoint of its two levels. The results of the analysis are shown in Figure 8.
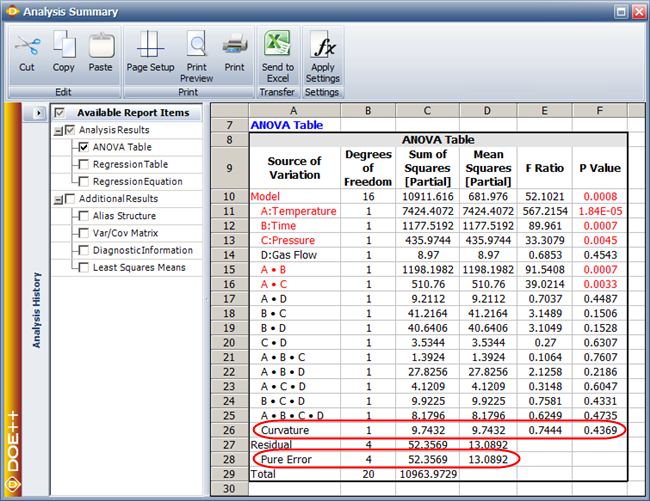
Figure 8: ANOVA Table
for Experiment with Center Points
The measurements at the center point have introduced a pure error that is used in the calculation of the p value. In addition, the ANOVA table indicates that the curvature is not significant, so the order of the model that is being used is appropriate. Again, the significant effects are found to be Temperature, Time and Pressure, as well as the interactions between Temperature/Time and Temperature/Pressure.
* The figures in this example are for demonstration purposes only and are not intended to be realistic.
References
[1] ReliaSoft Corporation, Experiment Design and Analysis Reference, Tucson, AZ: ReliaSoft Publishing, 2008.